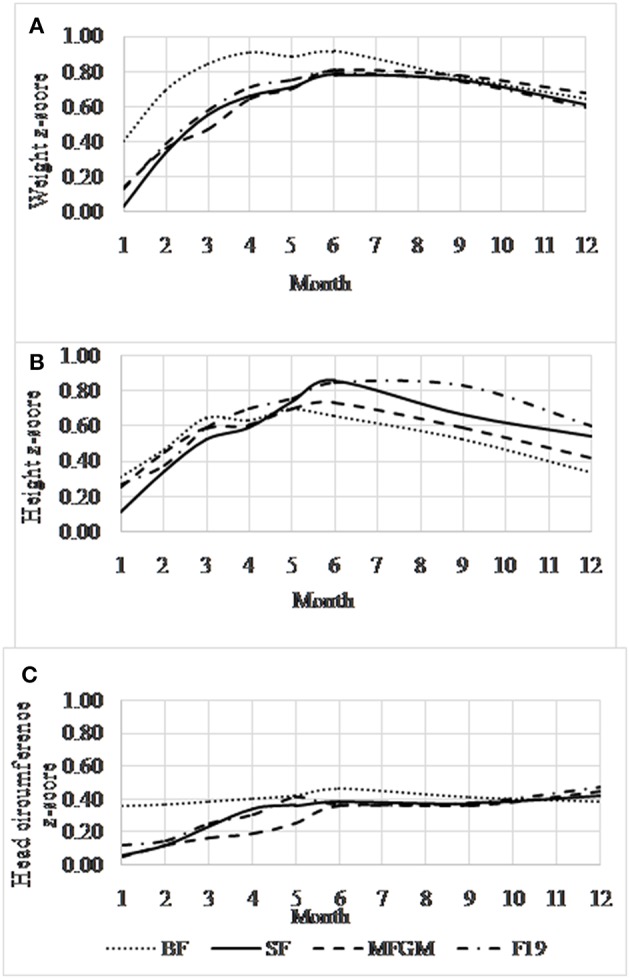
Figure 2.

Mean (95% confidence interval) age-adjusted anthropometric z-score data (y-axis) for the formula-fed and breastfed groups. Weight for age (A), length for age (B), and head circumference for age (C) using the World Health Organization reference population (31). BF, breastfed; SF, standard formula; MFGM, formula supplemented with milk fat globule membrane; F19, formula supplemented with L. paracasei ssp. paracasei strain (F19). There were no significant differences among the formula-fed groups in mean z-scores at any time point or for any of the growth variables.
