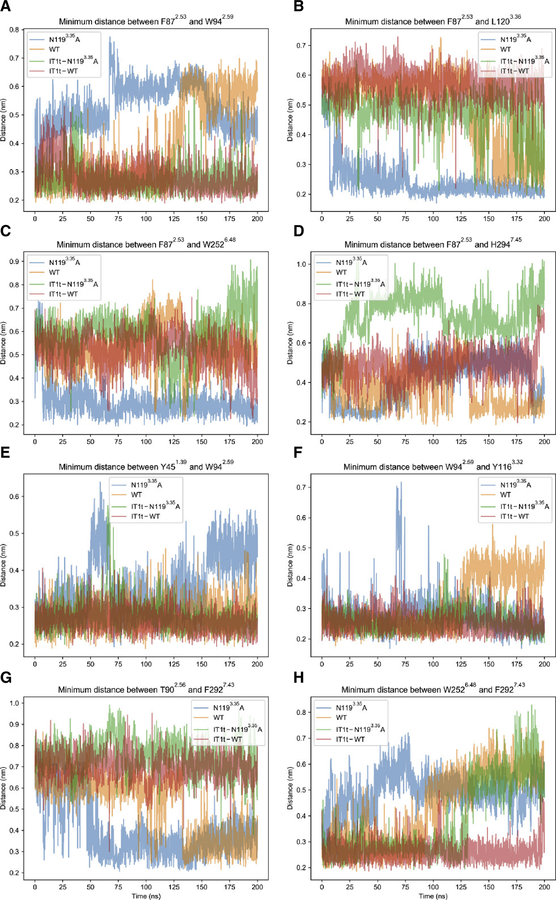
FIGURE 5.
Minimum distances between atom groups corresponding to selected residue pairs throughout molecular dynamics trajectories for apo CAM (blue), apo WT (orange), holo CAM (green), and holo WT (red). Note that the only active system is apo CAM. Each panel from (A) to (H) displays the distance-time profile for a different residue pair, as indicated by panel titles. Distances are shown in nm, and time index is shown in ns. The first 100 ns represent data from conventional molecular dynamics (MD) simulations, while the last 100 ns represent data from accelerated molecular dynamics simulations. When changing from conventional to accelerated MD algorithms, velocities and positions from the end of the prior simulation are used to restart the simulation resulting in a continuous trajectory. See also Figure S6.

