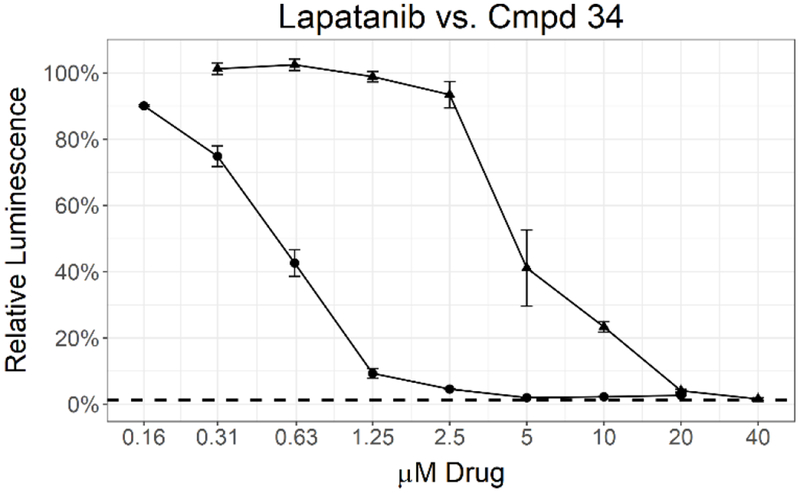
Figure 3.

MIC determination by two different assays for 34 (circle) and lapatanib (triangle). Data points represent the mean of 3 biological replicates with standard deviation. The dashed line labeled 1% inoculum represents an inoculation of 1 % of the number of cells used for compound testing. This control was used to determine 99 % inhibition of growth.
