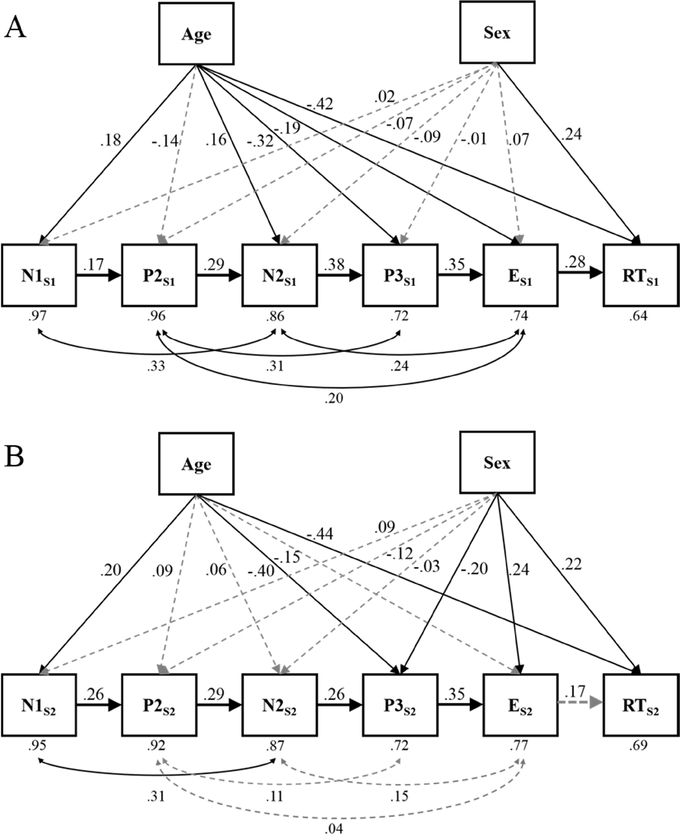
Figure 3.
The two manifest path models of neural processing predicting a task behavior (e.g. response time) while controlling for variance attributed to two trait characteristics of the individuals (Age and Sex): A depicts outcomes for Session 1 Go trials; and B depicts outcomes for Session 2 Go trials. Gray dotted arrows indicate non-statistically significant relationships, i.e., p > .05. Residual variances are reported below each variable. All reported coefficients are standardized.

