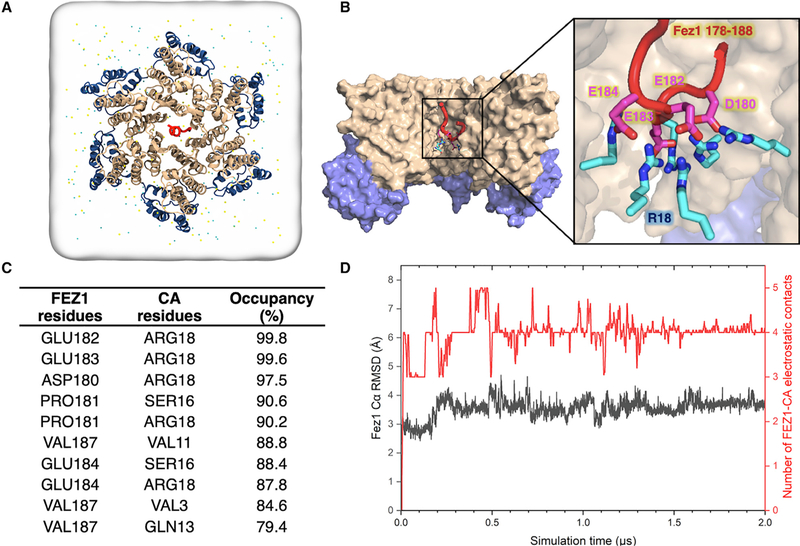
Figure 5. All-Atom Molecular Dynamic Simulations Identify FEZ1 Interactions at the CA Hexamer Center.
(A) All-atom model of FEZ1178–188 is placed at the center of the simulation box containing a CA hexamer, water, and 150 mM NaCl. Before the simulation, the initial location of the FEZ1178–188 segment is 24Å from R18. N-terminal domain (NTD) of CA (CANTD; gold), C-terminal domain (CTD) of CA (CACTD; blue), and FEZ1178–188 (red) are shown in a ribbon representation.
(B) Binding of FEZ1 to the CA hexamer after 2 μs of MD simulation. Surface representation of the internal hexamer center pore showing that FEZ1 interacts with the R18 residues of the CA hexamer (cyan and blue sticks) through negatively charged acidic residues (magenta and red sticks).
(C) List of the top 10 residues in the CA hexamer that are interacting with FEZ1178–188, showing that FEZ1178–188 is stably bound to R18 of the CA hexamer. The occupancy is calculated throughout the length of the simulation.
(D) Dynamics of FEZ1178–188 near a CA hexamer. FEZ1 quickly travels from the exterior of the hexamer to the interior (500 ns). After 500 ns, the interaction between FEZ1 and CA plateaus. The root-mean-square deviation (RMSD) plot of the FEZ1178–188 Cα atoms (in gray) and the electrostatic interactions with the CA hexamer (in red) during the simulation are shown.

