5.
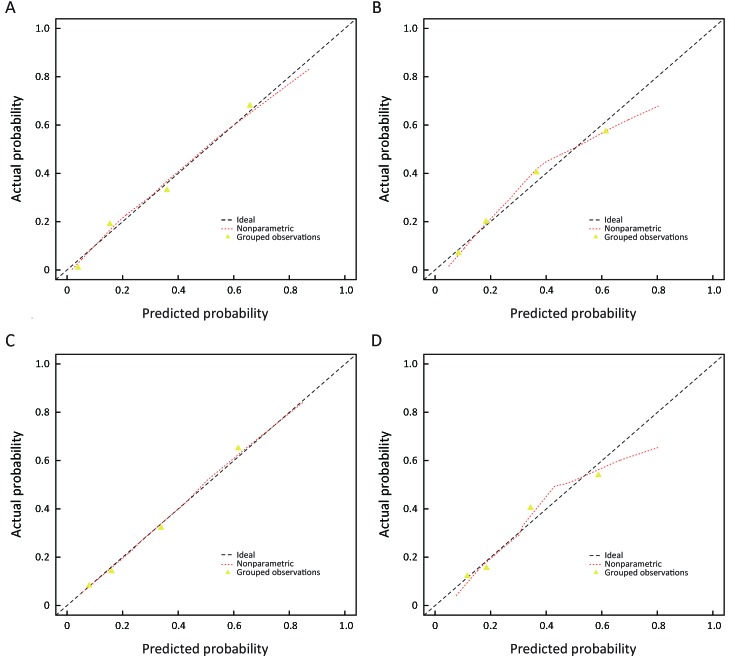
Calibration curves of radiomics-based predictive risk score (RPRS) and clinical model in development cohort and the independent validation cohort. RPRS (A) (P=0.622) and clinical model (C) (P=0.546) in development cohort; RPRS (B) (P=0.086) and clinical model (D) (P=0.084) in independent validation cohort. Diagonal line represents a perfect prediction.

