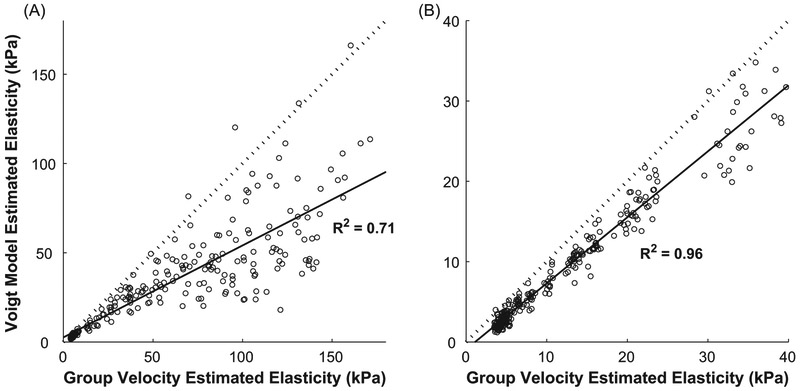
Figure 5.
Comparison of the elasticity estimated from the measured group velocity to that estimated from the Voigt model for active conditions (A) and passive conditions (B). The solid line shows the least square fit to the data. The dashed line has a slope of 1.0, which would indicate perfect correspondence between the two estimates of elasticity.

