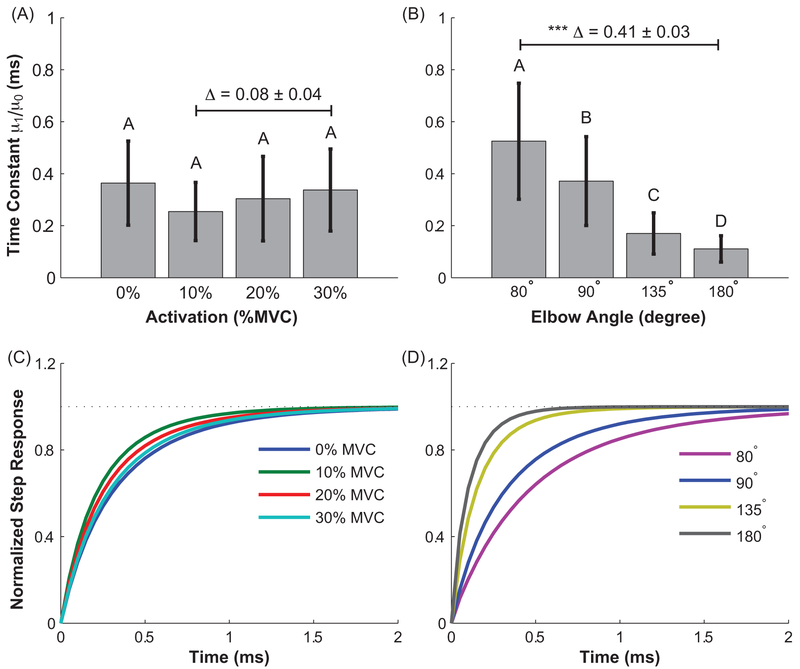
Figure 6.
The time constant of the Voigt model for active (A and C) and passive (B and D) conditions. Top row shows the average results across all subjects. The error bar indicates the standard deviation across subjects. Δ indicates the mean difference between the selected groups. Groups that do not share a letter indicate statistical difference. The bottom row illustrates the simulated step response of the average estimated Voigt models for each experimental condition.

