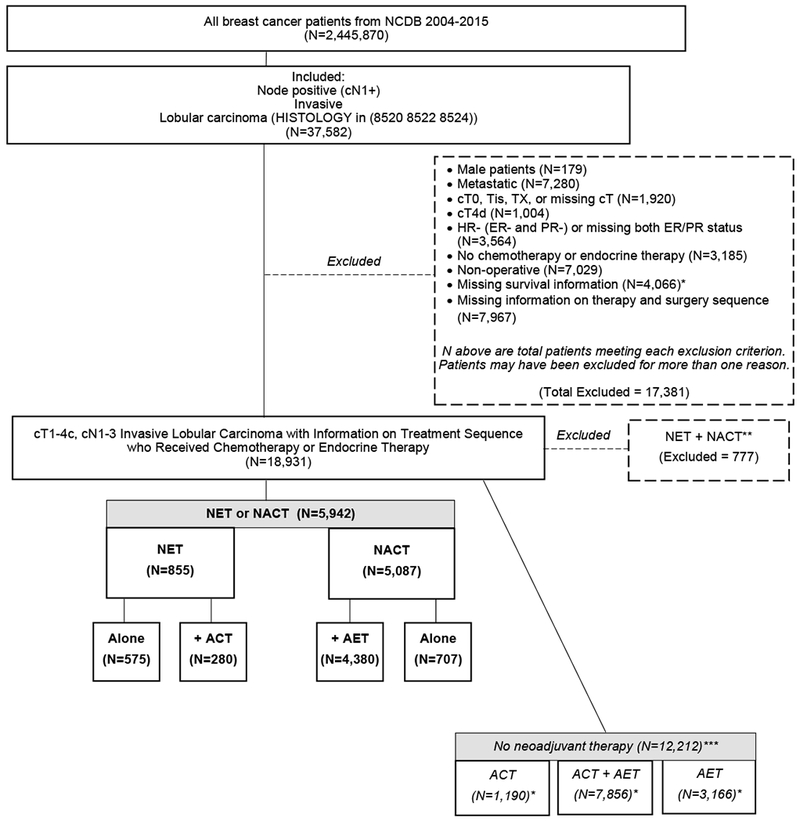
Figure 1. Patient Flow Diagram, Women with cT1-4c, cN1-3, HR+ Invasive Lobular Carcinoma, National Cancer Data Base, 2004-2014.

ACT, adjuvant chemotherapy. AET, adjuvant endocr ine therapy. NACT, neoadjuvant chemotherapy. NET, neoadjuva nt endocrine therapy. Boldface indicates inclusion in fina l study cohort (n=5,942). * Includes patients diagnosed in 2015. **Only included in calculation of NACT and NET rates over time (N=18,931). ***Only included in calculation of NACT and NET rates over time (N=18,931) as well as unadjusted overall survival analyses (N=18,154).
