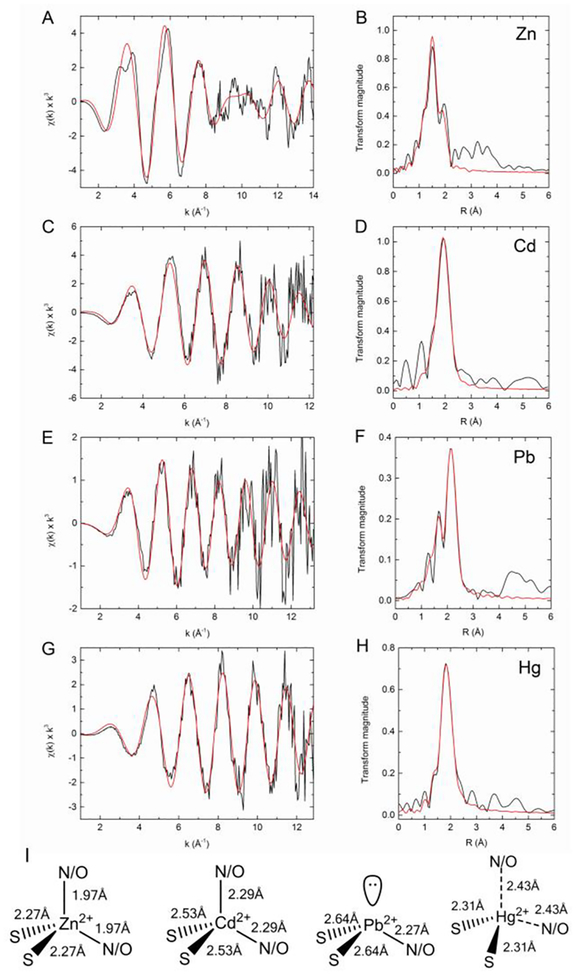
Figure 2:
XAS analysis of PaΔZntA121–740–M2+. K-edge experimental EXAFS data (black line) and best fits (red line) with the corresponding Fourier transforms for ΔZntA121–740–Zn2+ (A,B), ΔZntA121–740–Cd2+ (C,D), and L3-edge EXAFS data for ΔZntA121–740–Pb2+ (E,F) and ΔZntA121–740–Hg2+ (G,H; see Materials and Methods). The parameters for the best fits are listed in Table 1. (I) Models of the metal binding sites in PaΔZntA121–740–Zn2+, PaΔZntA121–740–Cd2+, PaΔZntA121–740–Hg2+ and PaΔZntA121–740–Pb2+ with the coordination geometries and metal-ligand bond distances.

