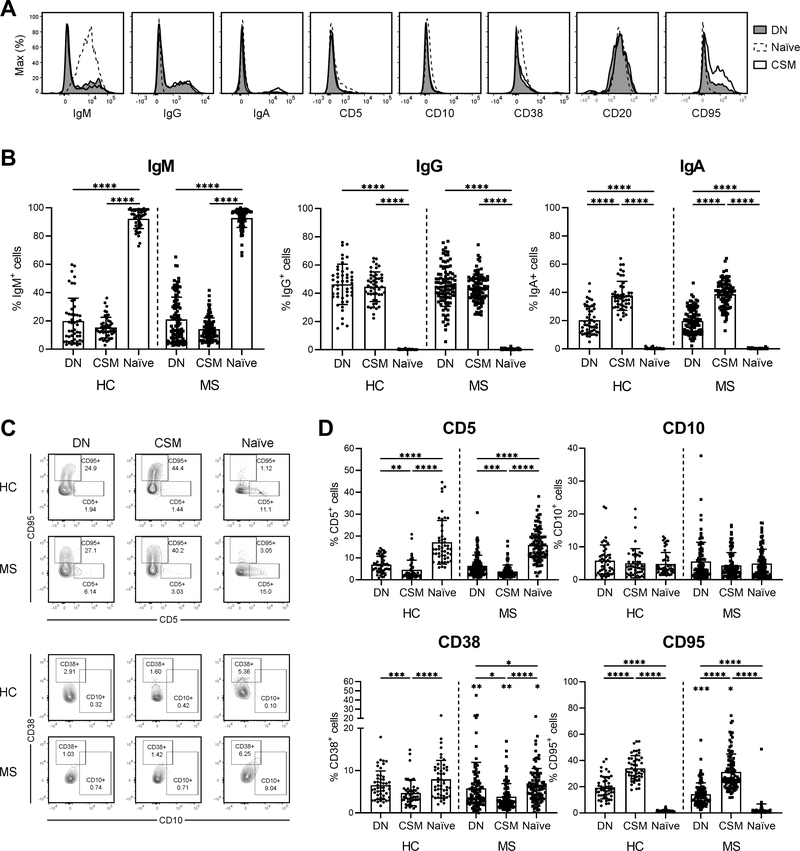
Figure 2. Phenotype of DN B cells in the peripheral blood of HC and MS patients.
(A) Representative surface staining of MS B cells for the indicated markers. DN B cells (shaded) are compared to naïve B cells (dashed line) and CSM B cells (solid line). (B) Percentages of IgM+, IgG+ and IgA+ cells within the DN, CSM and naïve B cell subsets in the peripheral blood of HC (n = 48) and MS patients (n = 96). Mean (bars) ± SD is depicted. (C) Representative flow cytometry from a HC and MS patient. The expression pattern of CD95 versus CD5 and CD38 versus CD10 is shown for DN, CSM and naïve B cells. (D) Percentages of CD5+, CD10+, CD38+ and CD95+ cells within the DN, CSM and naïve B cell subsets in the peripheral blood of HC (n = 48) and MS patients (n = 96). The significance levels shown without bars indicate differences in 1 B cell subset between HC and MS patients. Mean (bars) ± SD is depicted. * p < 0.05, ** p < 0.01, *** p < 0.001, **** p < 0.0001

