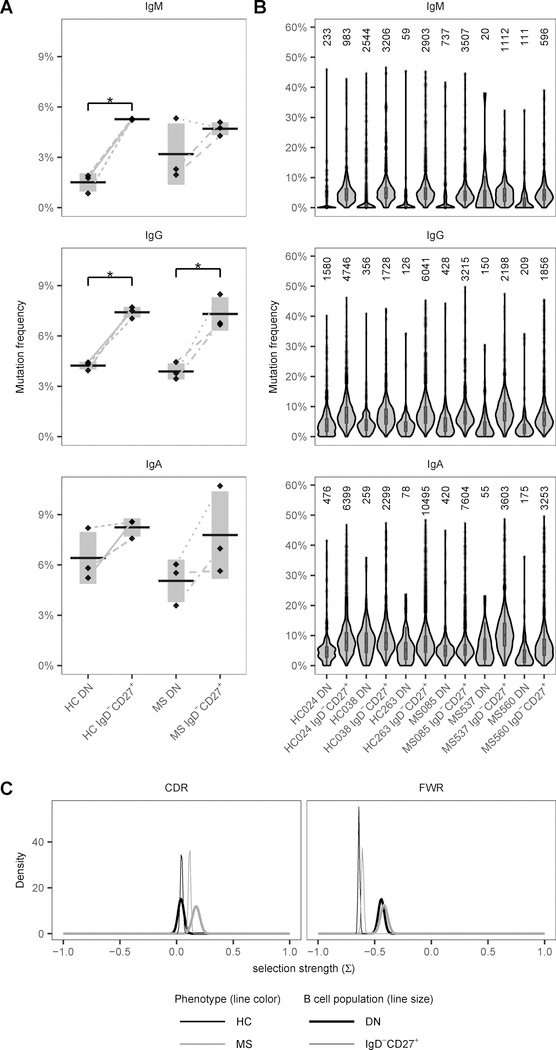
Figure 8. Mutational load of DN and IgD−CD27+ memory B cells of HC and MS patients.
(A) Distribution of the mean mutation frequency for the V region of IgM+, IgG+ and IgA+ sequences of the DN and IgD-CD27+ compartments is shown per HC or MS status. Mutation frequency for each sequence was calculated as the number of base changes from germline in the V region. Horizontal bars indicate the mean of the mean mutation rates with the vertical shading indicating ± 1 SD about the mean of means. (B) Distribution of the mutation frequency in the V region for the IgM, IgG and IgA isotypes is shown in the individual HC and MS patients. The number on top of the violin plots is the number of sequences in each sample. (C) BASELINe probability density functions (PDFs) from selection analysis are shown for DN and IgD-CD27+ repertoires of HC and MS patients, with density shown on the y-axis and the selection strength (∑) shown on the x-axis. PDFs for each status were determined via convolution of the individual PDFs for subjects within each status group, resulting in a single aggregate PDF for each status. * FDR < 0.20 and p < 0.05

