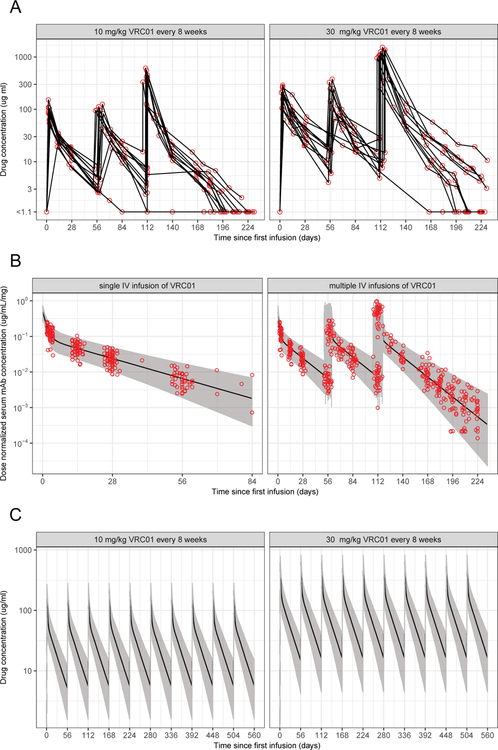
Figure 2:
(A) Observed VRC01 concentrations W at 0, 3 days and 2, 4, 8 weeks after each of the three infusions, and at one hour and 10–16 weeks after the last infusion for the 10 mg/Kg (left) and 30 mg/Kg (right) VRC01 dose arms in HVTN 104. (B) Predicted and observed dose-normalized VRC01 concentrations in HVTN 104 after a single (left) and multiple (right) intravenous infusion(s) based on the final popPK model described in Huang et al.10 (C) Simulated time-concentration data under perfect study adherence. Solid lines are medians; shaded areas are 2.5th and 97.5th percentiles over 500 simulated data sets. A body weight of 74.5 Kg is used.

