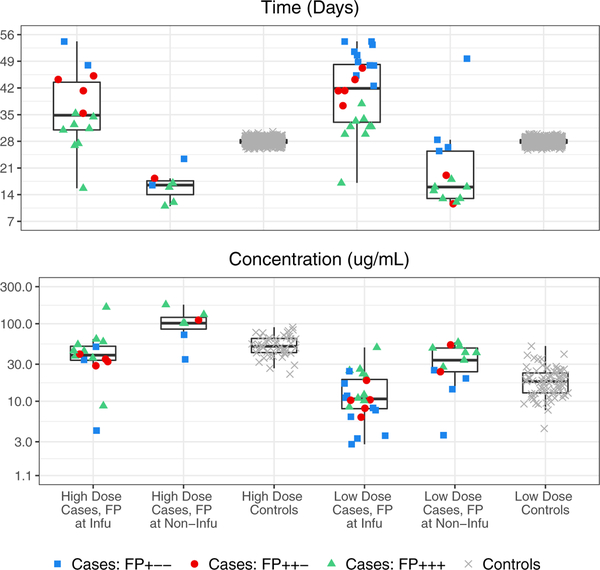
Figure 5.
For the pseudo-AMP trial data set by VRC01 dose group and FP visit type, boxplots of and of HIV infected cases and uninfected controls (Times Method, top panel), and of and (Marker Method, bottom panel). The outlier in the fifth boxplots from the left has FP visit at the Day 5 post second-infusion visit, with estimated infection time T* just before the second-infusion visit.

