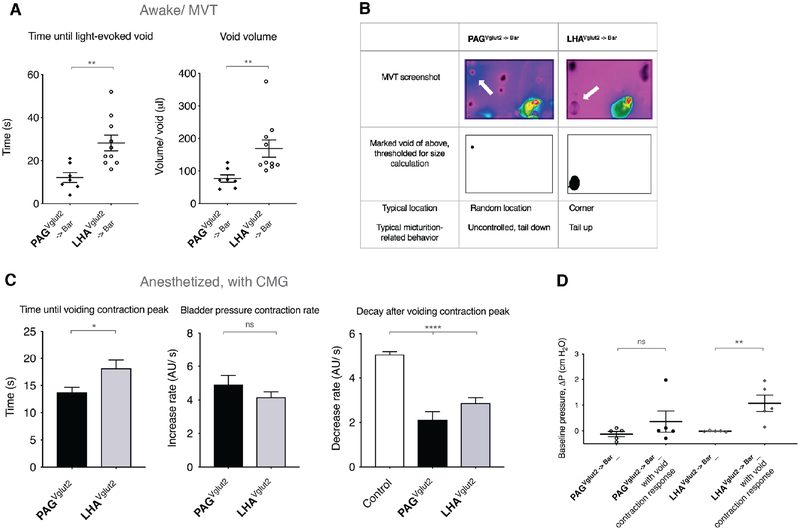
Figure 3. Optogenetic stimulation of axon terminals in Bar causes instant urinary incontinence or voiding in a designated place.
A) Averaged time until a light-evoked void from stimulation start (left graph), for PAGVglut2 -> Bar and LHAVglut2 -> Bar in awake mice. Unpaired t-test with Welch’s correction; **, p = 0.0022. Averaged volume per void of a light-evoked void (right graph), for PAGVglut2 -> Bar and LHAVglut2 -> Bar. Unpaired t-test with Welch’s correction; **, p = 0.0080.
Data are presented as mean ± s.e.m. in individual mice. PAGVglut2, 120 events in 7 mice; LHAVglut2, 101 events in 10 mice. See also Figure S3A.
B) Screenshot images of a video thermography, awake behavior recording. Arrows point to a light-evoked void during a stimulation trial. Below the screenshot is the indicated void of above, thresholded for void volume calculation. The lower row: typical location of a light-evoked void per condition, and typical behavior observed.
C) Left panel: Time until voiding contraction peak with light-stimulation under anesthesia. Unpaired t test with Welch’s correction; *, p = 0.0146.
Middle panel: Bladder pressure contraction rate from start of light stimulation until voiding contraction peak. Unpaired t test with Welch’s correction; ns.
Right panel: Pressure decrease in 15 seconds post light-evoked void contraction peak. One-way ANOVA; ****, p < 0.0001, followed by Dunnett’s test for multiple comparisons; ****, p < 0.0001 for PAGVglut2 -> Bar and LHAVglut2 -> Bar vs. control. BarControl, n = 29 spontaneous void events without light stimulation in 3 mice; PAGVglut2 -> Bar, 25 light-evoked void events in 4 mice; LHAVglut2 -> Bar, 51 light-evoked void events in 5 mice. Data are presented as sample mean ± s.e.m. See also Figure S3C.
D) Baseline bladder pressure prior to optogenetic stimulation, all responses versus void contraction responses only. Data are presented as population mean ± s.e.m., n = 5 mice (35 events). Mann-Whitney test; ns p = 0.44 between all responses and void responses for PAGVglut2 -> Bar axon terminal stimulation. n = 5 mice (87 events), **, p = 0.0079 all responses versus void responses for LHAVglut2 -> Bar axon terminal stimulation.
Abbreviations: Bar, Barrington’s nucleus; CMG, cystometrogram; ns, not significant; LHA, lateral hypothalamic area; MVT, Micturition Video Thermography; PAG, periaqueductal gray.
See also Figure S3.

