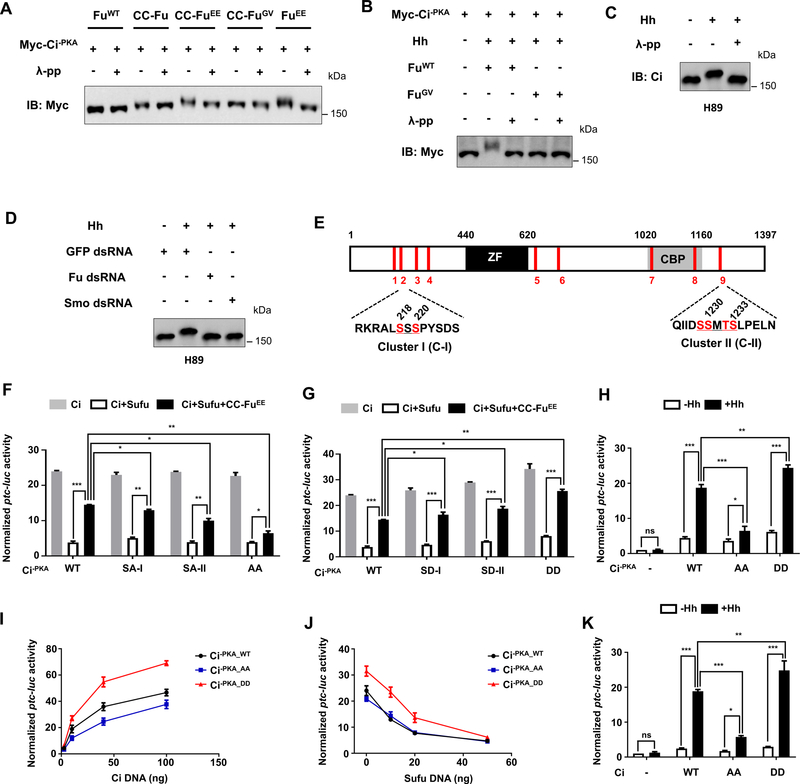
Figure 1. Characterization of Fu-mediated phosphorylation of Ci.
(A) Western blot analysis of Myc-Ci−PKA co-expressed with different forms of Fu in S2 cells treated with or without λ-protein phosphatase (λ-pp).
(B) Western blot analysis of Myc-Ci−PKA co-expressed with wild type (WT) or kinase dead (GV) Fu in S2 cells treated with Hh-conditioned medium.
(C-D) Western blot analysis of endogenous Ci from Cl8 cells treated with H89, the indicated dsRNAs, and Hh-conditioned medium.
(E) Schematic drawing of Ci protein. “ZF” and “CBP” indicate zinc finger domain and CBP binding domain, respectively. Red bars indicate the positions of potential Fu mediated Ci phosphorylation sites identified by MS. The primary sequences of two critical phosphorylation clusters (C-I and C-II) are shown below with phosphorylated S/T shown in red.
(F-G) ptc-luc reporter assay in S2 cells transfected with the indicated Ci−PKA constructs (50 ng/well) in the absence or presence of Sufu/CC-FuEE.
(H, K) ptc-luc reporter assay in S2 cells transfected with the indicated Ci constructs at low concentrations (5 ng/well) and treated with Hh-conditioned medium (+Hh) or control medium (−Hh).
(I-J) ptc-luc reporter assay in S2 cells transfected with increasing amount of the indicated Ci constructs (I), or fixed amount of the indicated Ci constructs (50 ng/well) and increasing amounts of Sufu (J).
Data in F, G, H, and K are mean ± SEM from three independent experiments. Data in I and J are mean ± SEM from two independent experiments. *p < 0.05, **p < 0.01 and ***p < 0.001 (Student’s t test). Also see Figure. S1, Figure. S2, and Table S1.

