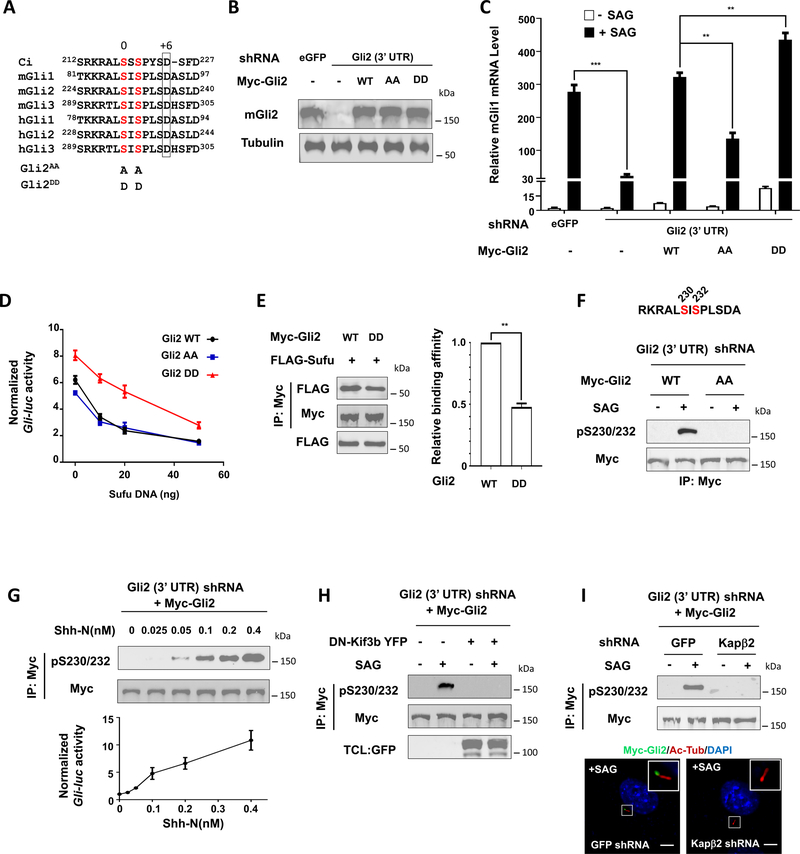
Figure 6. Shh signaling activates Gli2 by inducing its phosphorylation.
(A) Alignment of amino acid sequences surrounding the N-terminal phosphorylation sites in Ci, mouse (m) and human (h) Gli proteins.
(B) Western blot analysis to show Gli2 protein levels from NIH3T3 cells expressing the indicated shRNA and Myc-Gli2 lentiviral constructs.
(C) Relative Gli1 mRNA levels measured by RT-qPCR in NIH3T3 cells expressing the indicated shRNA and Myc-Gli2 lentiviral constructs with or without SAG. Data are mean ± SEM from two independent experiments. **p < 0.01 and ***p < 0.001 (Student’s t test).
(D) Gli-luc reporter activity in NIH3T3 cells expressing the indicated Myc-Gli2 constructs and increasing amounts of Flag-Sufu. Data are mean ± SEM from two independent experiments.
(E) Western blot analysis (left) and quantification (right) of Flag-Sufu coimmunoprecipitated with Myc-Gli2WT or Myc-Gli2DD. Data are mean ± SD from two independent experiments. **p < 0.01 (Student’s t test).
(F) Western blot analysis of Myc-Gli2 phosphorylation in NIH3T3 cells transduced with lentivirus expressing shRNA targeting Gli2 3’ UTR and lentivirus expressing either Myc-Gli2WT or Myc-Gli2AA in the absence or presence of SAG. The antigen sequence for generating the pS230/232 antibody is shown on the top.
(G) Western blot analysis of Myc-Gli2 phosphorylation (top) or Gli-luc reporter activity (bottom) in NIH3T3 cells transduced with lentivirus expressing shRNA targeting the 3’ UTR of Gli2 and lentivirus expressing Myc-Gli2WT (NIH3T3Gli2-shRNA/Myc-Gli2) in the presence of increasing amounts of Shh-N.
(H) Western blot analysis of SAG-induced Myc-Gli2 phosphorylation in NIH3T3Gli2-shRNA/Myc-Gli2 cells in the absence or presence of DN-Kif3b coexpression.
(I) Western blot analysis of SAG-induced Myc-Gli2 phosphorylation (top) or images of SAG-induced Myc-Gli2 ciliary localization (bottom) in NIH3T3Gli2-shRNA/Myc-Gli2 cells transduced with lentiviruses expressing shRNA targeting either GFP (control) or Kapβ2.
Ac-Tub: acetylated tubulin. Scale bars, 2.5 μM. Also see Figure S4.

