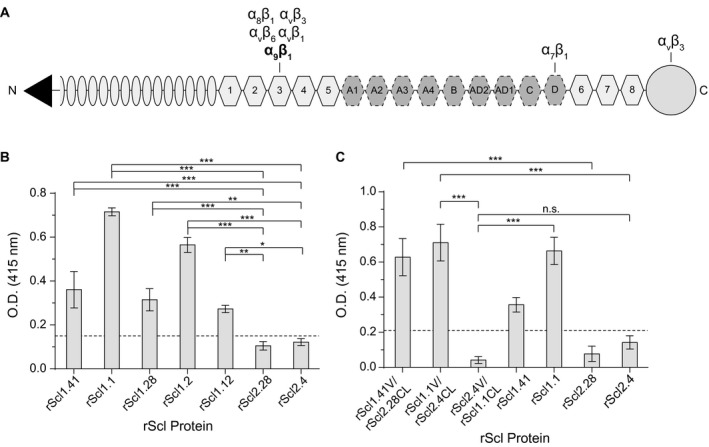
Figure 3.

Characterization of rScl1 and rScl2 binding to tenascin‐C (TnC). For ligand binding by ELISA, rScl proteins were immobilized onto Strep‐Tactin‐coated microplate wells and incubated with full‐length TnC. Primary anti‐TnC mAb and HRP‐conjugated secondary Ab were used for ligand detection. Graph bars indicate the mean OD415nm normalized against BSA controls. Statistical analysis was calculated using a one‐way ANOVA, from three independent experiments (unless noted otherwise), each performed in triplicate wells (N = 3 ± SD); *P ≤ 0.05, **P ≤ 0.01, ***P ≤ 0.001. Dashed line indicates threshold OD415nm +2SD values recorded for binding‐negative rScl2.28 control protein. A. Schematic representation of full‐length TnC. Depicted are from the N‐terminus: assembly domain (triangle), epidermal growth factor‐like repeats (ovals), constitutively expressed fibronectin type III repeats 1‐5 and 6‐8 (light hexagons), alternatively spliced fibronectin type III repeats (dark hexagons), and fibrinogen‐related domain (circle). Known integrin‐binding domains are marked above the model. B. TnC binding to recombinant Scl1‐ and Scl2 ‐derived constructs. rScl1 and rScl2 panel represents diverse Scl1 and Scl2 variants originating from strains of diverse M types. Statistical significance evaluates the differences in TnC binding by rScl1 proteins from M41, M1, M28, M2 and M12 strains, as compared to rScl2 control proteins from M28 and M4 strains. C. Identification of the Scl1 domain responsible for TnC binding. A set of rScl proteins were tested for binding to TnC by ELISA that included the original rScl1 (rScl1.41, rScl.1) and rScl2 (rScl2.28, rScl2.4) proteins, as well as constructs generated via domain swapping; domain compositions for those rScl constructs are shown underneath the graph. Statistical significance evaluates the differences in TnC binding, as depicted on the graph. Two independent experiments were performed, using triplicate wells.
