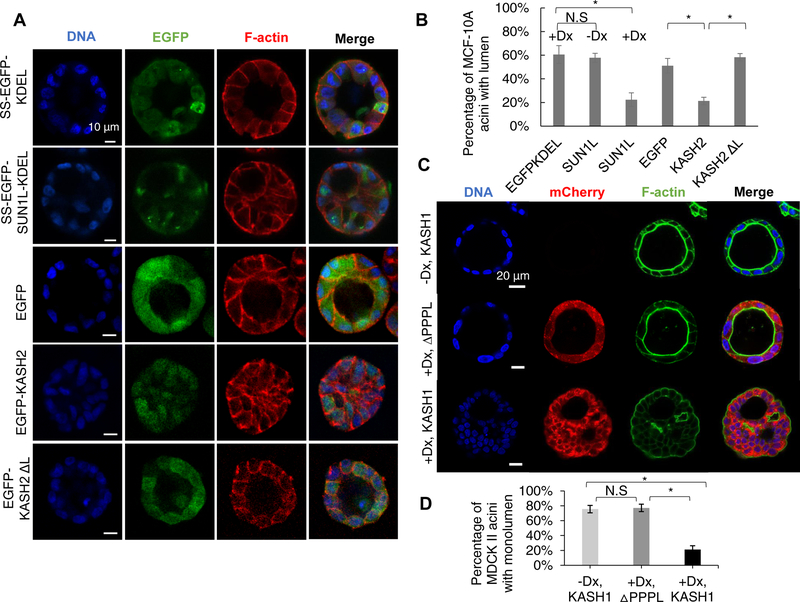
Figure 1. Disruption of the LINC complex results in lumen occlusion during acinar development by MCF-10A and MDCK II cells.
LINC complex disruption was induced by doxycycline before seeding on the Matrigel™. (A) Fluorescent images of representative acini formed by MCF-10A cells expressing the proteins indicated in the left column. Scale bar, 10 mm. (B) Occurrence of MCF-10A acini with a lumen under different conditions presented in (A). EGFPKDEL: SS-EGFP-KDEL, SUN1L: SS-EGFP-SUN1L-KDEL (-Dx, without doxycycline, +Dx, with doxycycline), KASH2: EGFP-KASH2, KASH2 ΔL: EGFP-KASH2. If one or more cells were observed inside the three-dimensional lumen, as visualized using z-stack confocal microscopy, the acinus was scored as lacking a lumen; n ≥ 93 acini from at least three experiments for each condition. Error bars represent ± SEM (* p < 0.05, Student’s t-test with Bonferroni corrections). (C) Fluorescent images of representative acini formed over a period of 7 days by uninduced MDCK II cells (-Dx, KASH1), by MDCK II cells inducibly expressing mCherry-KASH1ΔPPPL induced with doxycycline on day −1 (+Dx, DPPPL) or by MDCK II cells inducibly expressing mCherry-KASH1 induced with doxycycline on day −1 (+Dx, KASH1). DNA and F-actin were imaged through Hoechst and phalloidin staining respectively. Scale bar, 20 μm. (D) Occurrence of MDCK II acini with a single lumen under different conditions in (E). n≥120 acini from 3 independent experiments for each condition. Error bars represent ± SEM (*p<0.001, One-Way ANOVA with post-hoc Tukey (HSD) test). Also see Figure S1 and S2 for validation of LINC complex disruption.

