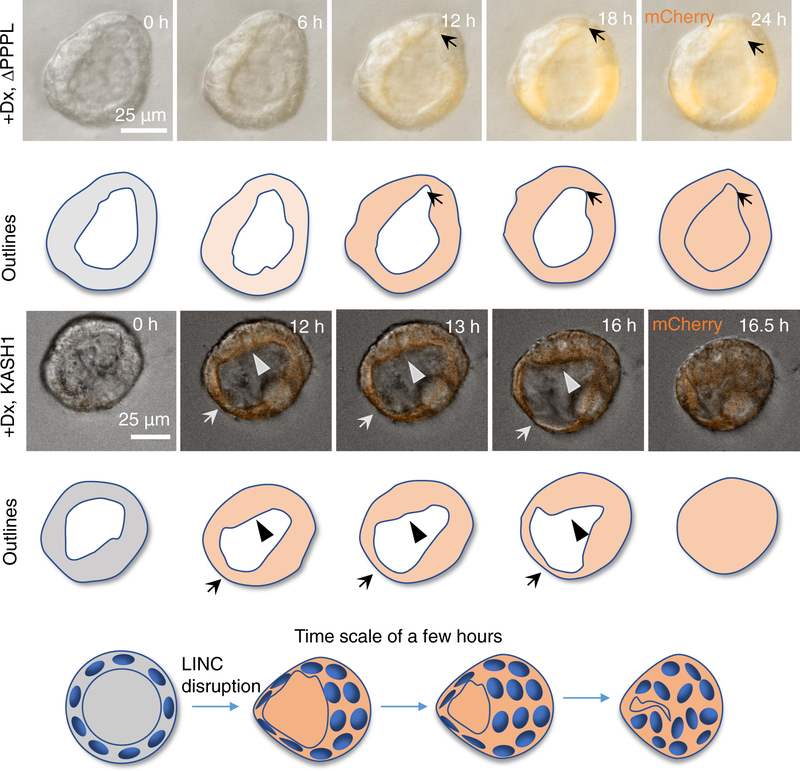
Figure 3. LINC disruption destabilizes the acinus.
Time-lapse differential interference contrast (DIC) microscopy images overlaid with fluorescent images of mCherry-KASH1ΔPPPL (+Dx, ΔPPPL) or mCherry-KASH1 (+Dx, KASH1) showing shape fluctuations of the MDCK II cell acinar boundaries and corresponding outlines (the expression of either protein was induced by doxycycline, Dx, added at time = 0 h) (see also Video S1). In the top panel, local thinning is observed (arrow, starting at 12 h) in the control acinus, which recovers by 18 h. Such thinning/thickening followed by recovery was seen in 23 acini that did not collapse out of 23 assayed mCherry-KASH1ΔPPPL acini from 6 different experiments. Conversely, in the mCherry-KASH1 acinus, there is thinning (arrow) and thickening (arrowheads), at the opposite poles. The thick boundary continues to thicken, moves inward, and eventually meets the thin boundary, resulting in acinar collapse (after 16 h) (see also Videos S2, S3 and S4). The thick boundary covers the distance of the acinar radius in approximately 3 h to collapse the acinus. Such collapse was observed in 35 acini out of 50 assayed acini in 5 different experiments. The model shows how the local thinning and thickening of cells result in lumenal collapse in pre-developed acini formed by LINC disrupted MDCK II cells. Cell boundaries are not shown in the cartoon. See also Figure S3 for the effect of LINC complex disruption on the geometric properties of MCF-10A and MDCKII acini.

