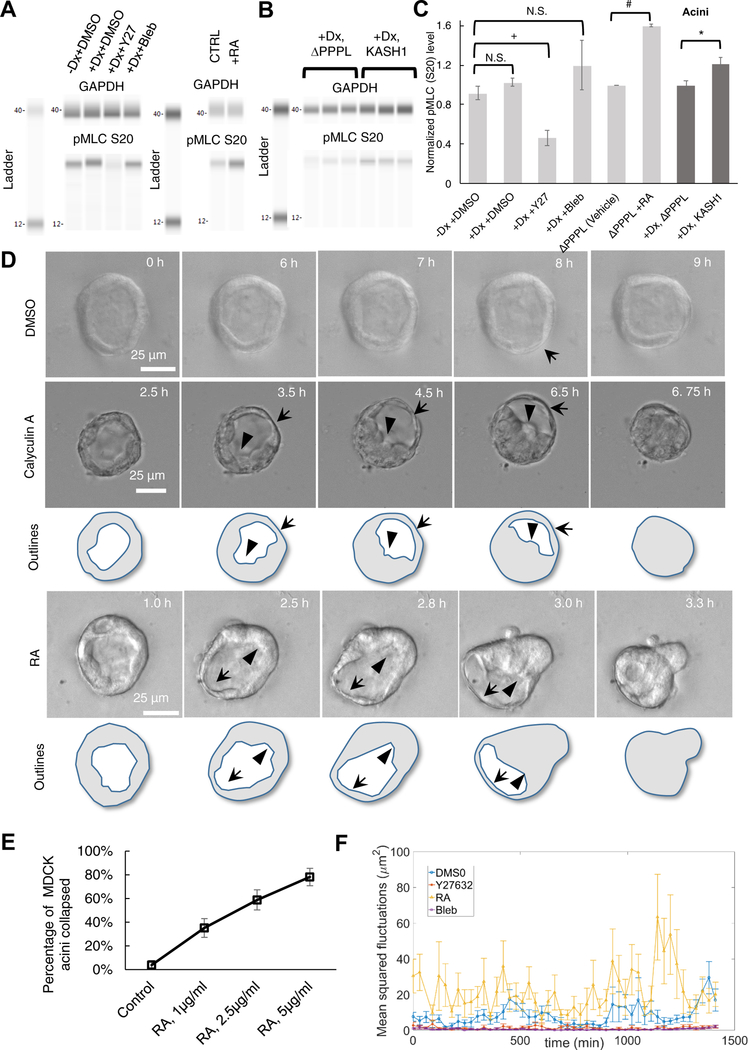
Figure 4. Levels of phosphorylated myosin II regulatory light chain (pMLC) increase upon LINC complex disruption in acini, and increased actomyosin contractility causes lumenal collapse.
(A) Western blot of pMLC levels detected using anti-myosin light chain (phospho S20) antibody in lysates from MDCK II cells cultured in two-dimensional tissue culture dishes. +Dx indicates doxycycline treatment for 1 day to induce the expression of mCherry-KASH1. The effect of 40 μM Y27632 (Y27), 50 μM blebbistatin (Bleb) treatment on pMLC levels are shown; DMSO was included as vehicle control. Also shown is the effect of 1 μg/ml Rho activator II treatment. GAPDH was used as loading control; N ≥ 4 per condition (except Rho activator II, where N = 2). (B) Western blot analysis of pMLC levels detected using anti-Myosin light chain (phospho S20) antibody from MDCK II acini formed through culture in three-dimensional Matrigel™. Doxycycline (Dx) was added to induce expression of mCherry-KASH1ΔPPPL and mCherry-KASH1 for 1 day before seeding cells in Matrigel™, and cells were harvested from acini after 7 days. GAPDH was used as loading control and N = 6 biological replicates were assayed. See also Figure S4 for immunofluorescence data with the anti-Myosin light chain (phospho S20) antibody. (C) Plot shows the normalized pMLC levels corresponding to the data in (a) and (b). Error bars indicate ± SEM (*p<0.05 by student’s t-test for statistical comparisons with Bonferroni corrections for multiple comparisons). (D) Time-lapse DIC and fluorescent images of acini formed over 7 days in three-dimensional culture by uninduced MDCK II cells, followed by treatment with DMSO (vehicle control), 5 nM calyculin A (see Videos S5 and S6) or 2.5 μg/ml Rho activator II (see also Video S7) at time = 0 h. Images are representative of 40 acini that did not collapse out of 43 assayed in 6 different experiments under DMSO treatment, 31 acini that collapsed out of 31 assayed under Calyculin A treatment in 3 different experiments, and 20 acini that collapsed out of 34 assayed under Rho activator II treatment in 3 different experiments. Local thinning is indicated by arrows and local thickening by arrowheads. (E) Plot shows the percentage of acini that collapsed as a function of the dose of Rho activator II (RA). At least 26 acini from 3 independent experiments were assayed for each dose. (F) Plot shows the mean squared fluctuations in acinar thickness (quantified at two locations in each acinus) in uninduced mCherry-KASH1 cells treated with 40μM Y27632, 1 μg/ml Rho activator II (see Video S8) or 50 μM Blebbistatin (see Video S9). DMSO served as vehicle control. Data in the plot represents results from live imaging of at least 6 acini from 3 independent experiments, corresponding to at least 12 time series for each condition.

