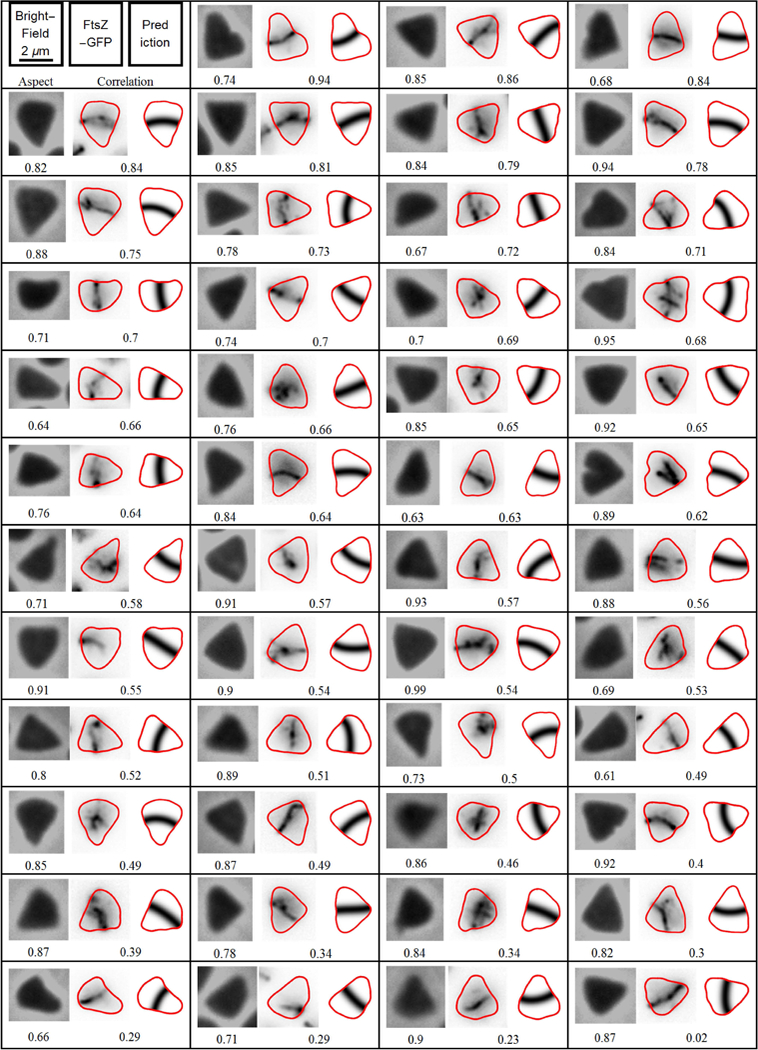
Fig. 3. Experimental cell division orientation in triangular H. volcanii cells.

An array showing the division plane orientation in the cells of the CetZ1 knockout of H. volcanii (ID59 + pIDJL40-FtsZ1) that have formed triangular shapes. The left-hand number of each panel is the aspect ratio of the cell outline, while the right-hand number is the resulting cross-correlation between prediction and observation. The left most image is the phase-contrast micrograph, the middle image is the experimental FtsZ1 fluorescence distribution and the right most image is the predicted division plane. The cells have been ordered by the cross-correlation between the predicted and observed division.
