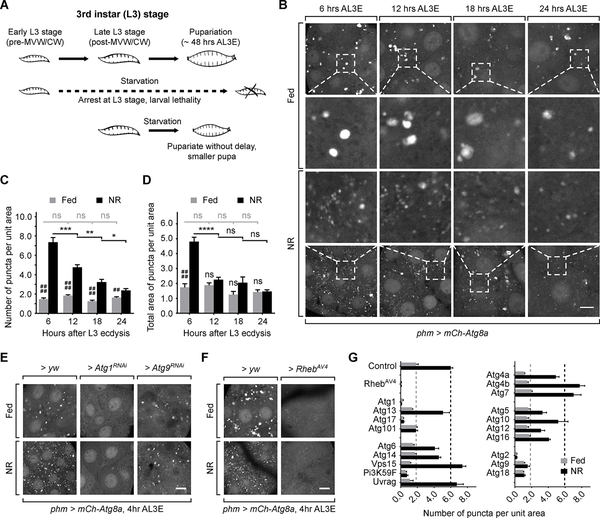
Figure 1. Autophagy in the PG is temporally regulated during the L3 stage.
Schematic diagram showing the metamorphic timing response of larvae under NR stress. (B) Autophagy visualized by mCh-Atg8a in PG cells. Larvae were dissected and imaged immediately for fed groups, or after 4 hours starvation for NR groups. Magnified images of the indicated areas are also shown. Scale bar, 10 μm. (C and D) Quantification of the number (C) and the total area (D) of Atg8a-positive puncta per unit PG cell area (100 μm2) of fed and starved larvae. Mean ± SEM; p values by unpaired t-test (n=8; ns, not significant, *p<0.05, **p<0.01, ***p<0.001, ****p<0.0001, ##p<0.01, ####p<0.0001). (E and F) Autophagy visualized by mCh-Atg8a in pre-NRC (4 hours AL3E) phm>yw, phm>Atg1RNAi, phm>Atg9RNAi and phm>RhebAV4 PG tissues. (G) Quantification of the number of Atg8a-positive puncta per unit cell area (100 μm2) in the Atg gene knockdown and Rheb overexpression PGs. Mean ± SEM. (n=3–5).

