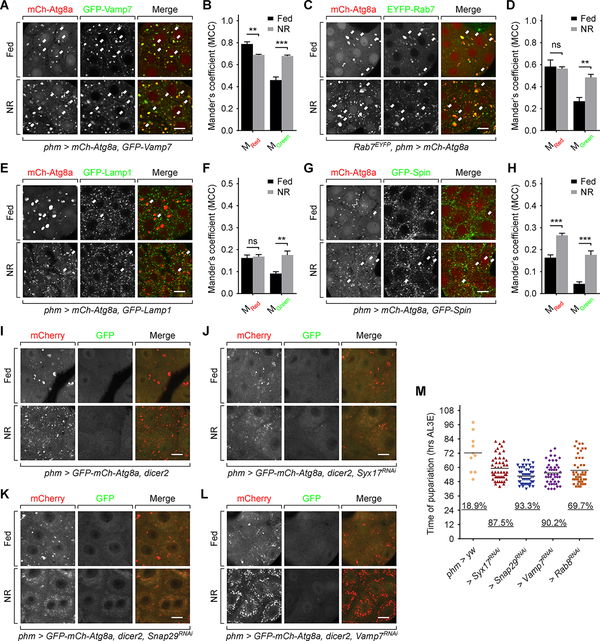
Figure 6. Autophagy affects cholesterol trafficking by interacting with endo/lysosomes.
(A, C, E and G) Images of PGs expressing mCh-Atg8a and GFP-Vamp7 (A), EYFP-Rab7 (C), GFP-Lamp1 (E) or GFP-Spin (G). Arrows indicate overlaps of mCh-Atg8a and EYFP/GFP signals. Scale bars, 10 μm. (B, D, F and H) Mander’s colocalization analyses of corresponding images in (A, C, E and G). Mean ± SEM; p values by unpaired t-test (n=5–7; ns, not significant, **p<0.01, ***p<0.001). (I to L) Autophagy visualized by tandem tagged Atg8a in phm>dicer (I), phm>SyxRNAi,dicer (J), phm>Snap29RNAi,dicer (K) and phm>Vamp7RNAi,dicer (L) PGs. Scale bars, 10 μm. (M) Pupariation activity of SNARE proteins and Rab8 knockdown larvae during early L3 (4 hours AL3E) starvation. The scattered dots indicate the time of pupariation of each individual larva. The underscored numbers indicate the percentage rate of pupariation. For each group n > 50 larvae.
See also Figure S5.

