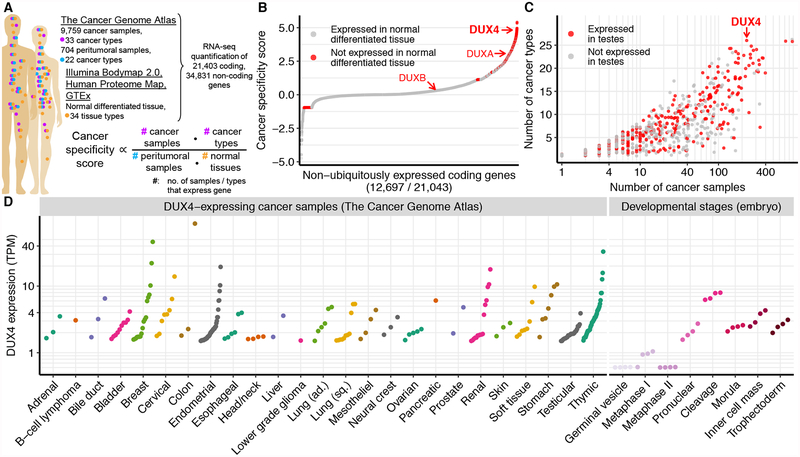
Figure 1. Identification of genes with cancer-specific expression.
(A) Overview of data sources and our strategy for identifying cancer-specific gene expression. We compared the expression of each gene in cancer samples (TCGA) to its corresponding expression in peritumoral samples (TCGA) and normal tissue from healthy individuals (Illumina Body Map 2.0, Human Proteome Map, and Genotype-Tissue Expression Project, GTEx). We defined the cancer specificity score for each gene as the logarithm of the fractions of cancer samples and types in which the gene was expressed divided by the fractions of peritumoral samples and normal tissues in which the gene was expressed.
(B) Ranked plot of cancer specificity scores of coding genes, restricted to genes that are not expressed in all tissue types. The double homeobox genes DUX4, DUXA, and DUXB are highlighted.
(C) Expression of cancer-specific genes across cancer types and samples. Each point corresponds to a gene highlighted in red in (B). y axis, number of cancer types (TCGA primary site) with at least one DUX4+ sample; x axis, total number of DUX4+ samples, irrespective of cancer type.
(D) DUX4 mRNA levels in DUX4+ cancer samples and during early embryogenesis (Hendrickson et al., 2017). TPM, transcripts per million.
See also Figure S1.

