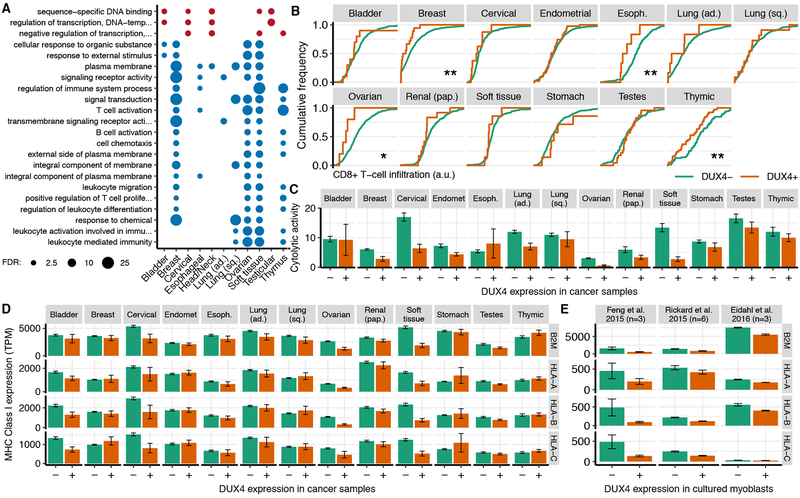
Figure 4. DUX4 is associated with cancer immune evasion.
(A) Gene Ontology (GO) terms that were enriched for genes that were differentially expressed in DUX4+ versus DUX4− samples across multiple cancer types. Plot is restricted to the child-most GO terms with a False Discovery Rate (FDR) ≤ 0.01 after Benjamini–Hochberg correction. Circle areas are proportional to −log10 (FDR).
(B) Estimated CD8+ T cell infiltration in DUX4− and DUX4+ cancers, where infiltration was estimated with the TIMER method (Li et al., 2017). */**, p < 0.05/0.01 by the one-sided Mann-Whitney U test.
(C) Mean estimated cytolytic activity in DUX4− and DUX4+ cancers. Cytolytic activity was estimated as the geometric mean of GZMA and PRF1 gene expression (Rooney et al., 2015). Error bars, standard deviations estimated by bootstrapping.
(D) Mean expression of canonical MHC Class I genes, where the mean was computed over all DUX4− and DUX4+ cancers for each type. Error bars, standard deviations estimated by bootstrapping. TPM, transcripts per million.
(E) As (D), but for the illustrated datasets. Feng et al. 2015 introduced DUX4 via lentivirus into 54–1 and MB135 myoblasts (Feng et al., 2015), Rickard et al. 2015 sorted DUX4− and DUX4+ myoblasts following induction of differentiation for myoblasts that spontaneously express DUX4 (Rickard et al., 2015), and Eidahl et al. 2016 transfected DUX4-expressing plasmids into WS236 myoblasts (Eidahl et al., 2016). n, number of replicates.
See also Figure S4.

