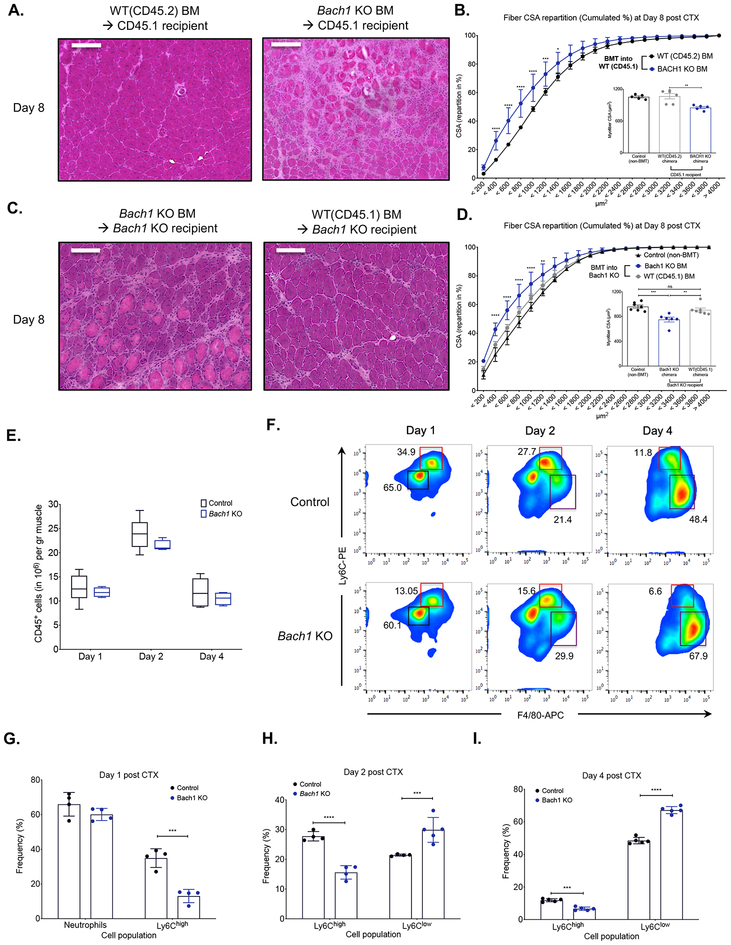
Fig. 3. Altered phenotypic transition of infiltrating myeloid cells in Bach1-deficient models following CTX injury.
A. Representative images of H&E stained TA skeletal muscle 8 days after CTX injury from chimeric WT BoyJ bone marrow-transplanted (BMT) animals (CD45.1 recipients) that received either WT (CD45.2) or Bach1-KO bone marrow. Scale bars in the upper left corner represent 100 μm.
B. Cumulated myofiber cross sectional area repartition and mean CSA (inset panel) at day 8 post CTX injury from WT chimeric animals transplanted with either WT (CD45.2) or Bach1-KO bone marrow (n=5 mice per group).
C. Representative images of H&E stained TA skeletal muscle 8 days after CTX injury from chimeric Bach1-KO BMT animals that received either WT (CD45.1) or Bach1-KO bone marrow. Scale bars in the upper left corner represent 100 μm.
D. Cumulated myofiber cross sectional area repartition and mean CSA (inset panel) at day 8 post CTX injury from Bach1-KO BMT animals transplanted with either WT (CD45.1) or Bach1-KO bone marrow (n=6 mice per group).
E. Number of infiltrating myeloid (CD45+) cells in regenerating muscle from WT-control, and Bach1-KO muscles at indicated timepoints post CTX injury (n=8 muscles per group).
F. Representative flow cytometry images of inflammatory and repair MFs from WT-control and Bach1-KO at indicated timepoints post CTX injury. Squares indicate the gating used for cell frequency quantification (black=PMNs, red=Ly6Chigh inflammatory MFs, purple=Ly6Clow repair MFs). Representative frequencies for each cell population are shown adjacent to each gate.
G. H., and I. Frequency (in %) of CD45+ inflammatory (Ly6Chigh F4/80low) and repair (Ly6Clow F4/80high) MFs from WT-control and Bach1-KO mice at indicated timepoints following CTX injury (n = 4 mice per group).
In all bar graphs, bars represent mean ± SEM.

