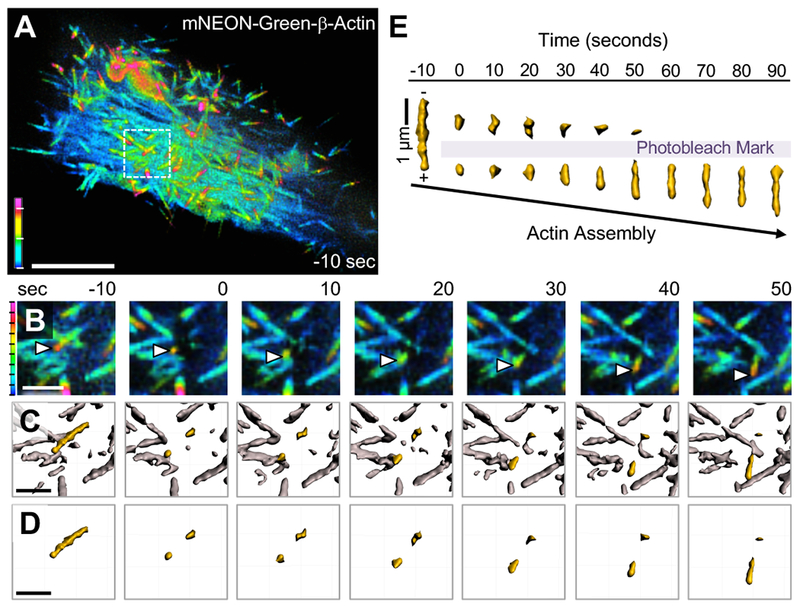
Figure 3. Microvillar F-actin cores undergo treadmilling during motility.

(A) SDCM of a CL4 cell expressing mNEON-Green-β-actin viewed as a depth-coded z-projection. Scale bar is 10 μm, z-axis depth code with tick marks at 1 μm intervals is shown at lower left. (B) Time series montage of area in A highlighted by white dashed box, enlarged, cropped in z to remove cytoplasmic signal, then viewed as a depth-coded z-projection. Time series shows region of interest before photobleaching (−10 seconds), immediately after photobleaching (0 seconds), and during recovery. White arrowheads mark the growing distal tip of a microvillus. (C) Data from B were processed using Imaris to create a 3D surface of the fluorescent actin signal with the microvillus of interest highlighted in yellow. (D) Time series montage showing the isolated microvillus of interest before and after photobleaching. In B-D, scale bar is 2 μm, z-axis depth code (left) with tick marks at 200 nm intervals. (E) The microvillus of interest from D was viewed orthogonally over time and aligned based on the position of the bleached region to highlight treadmilling of the mark through the actin core. Shown here is a representative example of treadmilling observed from n > 20 cells.
