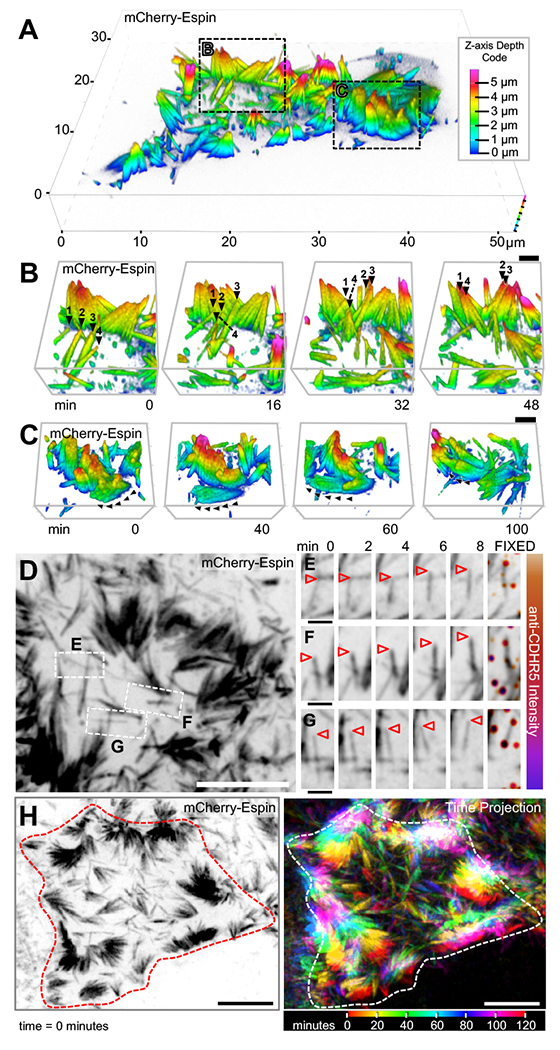
Figure 5. Microvillar motility promotes intermicrovillar collisions, adhesion, and cluster formation.

(A) SDCM of the apical surface of a CL4 cell stably expressing mCherry-Espin at 2 DPC, visualized as a depth-coded composite. Image scale is shown on volume frame, depth scale is shown to the right. (B,C) Times series montages of areas highlighted in A, enlarged and rotated to optimize visualization of microvillar movement. In B, individual microvilli of interest are marked at each time point with numbered black arrowheads. In C, black arrowheads mark the path of motion for a cluster of microvilli. Scale bars are 2 μm. Z-axis depth code shown in A also applies to B and C. (D) SDCM of the apical surface of a CL4 cell stably expressing mCherry-Espin at 2 DPC, visualized as a maximum intensity z-projection. Image scale is 10 μm. (E-G) Time series montages of areas highlighted in D, enlarged and rotated to visualize microvillar movement, then fixed and stained for CDHR5 (far right panel). Tips of individual microvilli are marked with arrowheads. Image scales are 2 μm. (H) SDCM of the apical surface of a CL4 cell stably expressing mCherry-Espin at 2 DPC, visualized as a maximum intensity z-projection at time = 0 (left panel) and as a time projection over 120 minutes (right panel). Time scale at lower right. Image scale is 10 μm. Cell edge at time = 0 minutes outlined in red (left panel) or white (right panel).
