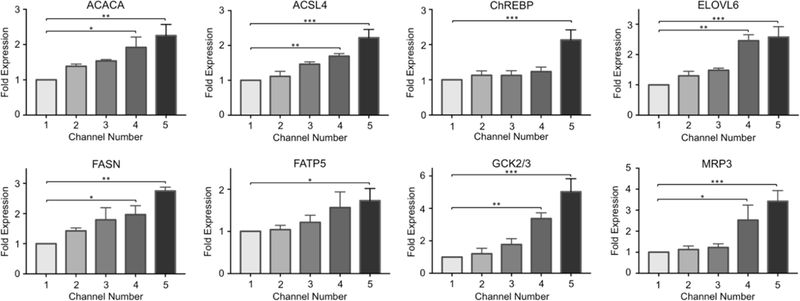
Figure 3. Fold gene expression changes of NAFLD pathogenesis and lipid metabolism markers.

The changes in the mRNA levels of the following markers were quantified via quantitative real-time PCR: acetyl-CoA carboxylase α (ACACA), acyl-CoA synthetase long chain family member 4 (ACSL4), carbohydrate responsive element-binding protein (ChREBP), elongation of long-chain fatty acids family member 6 (ELOVL6), fatty acid synthase (FASN), fatty acid transporter protein 5 (FATP5), glucokinase (GCK) and efflux transport multidrug resistance-associated protein 3 (MRP3). The data are presented as mean ± SEM. N ≥ 3, * = p < 0.05, ** = 0.010 < p < 0.050, *** = 0.001 < p < 0.010.
