
Figure 5. Effect of oxygen deprivation on lipid accumulation.
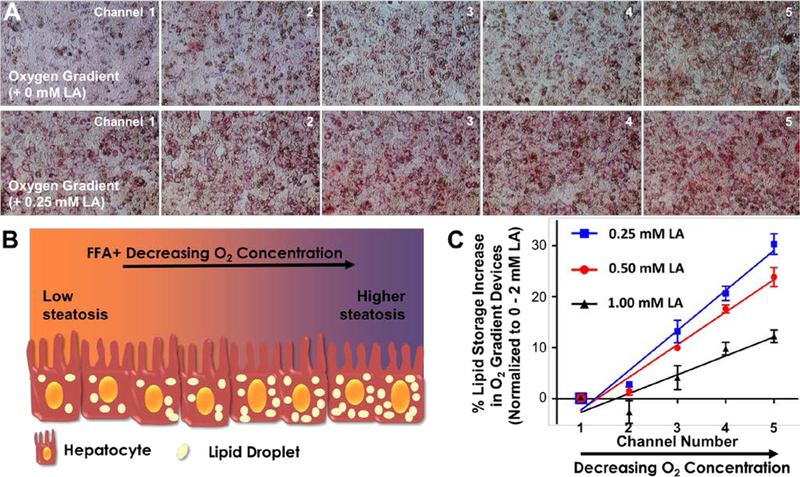
(A) Representative channel pictures of hepatocytes subjected to an oxygen gradient of 11.2% – 6.9%, top panel: no additional linoleic acid (LA) supplementation, bottom panel: in the presence of 0.25 mM LA supplementation. (B) Cartoon representation of the hypothesized effect of oxygen deprivation on lipid accumulation (represented by beige ellipses). (C) Quantification of percent lipid accumulation in oxygen gradient devices supplemented with varying levels of LA. The absolute values of each channel were normalized to the 0 mM - 2 mM LA control device, of which channels 1 and 5 were assigned to 0 % and 100 %, respectively. The solid lines for all three groups represent the linear regression analyses which are used to determine the slope for each group and thus the magnitude of the effects the oxygen gradient. The data are presented as mean ± SEM.