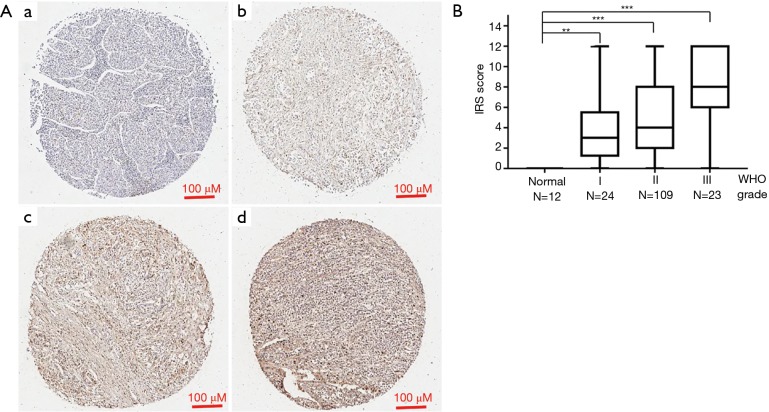
Figure 3.
Expression of APOC1 protein is much higher in GC than normal tissues. (A) Representative pictures of GC in tissue microarray by IHC, a (negative), b (weak brown), c (moderate brown), d (strong brown). (B) Expression of APOC1 protein was higher in GC than normal tissues. Expression APOC1 protein was increased as GC developed. APOC1, apolipoprotein C1; GC, gastric cancer; IHC, immunohistochemistry. **, P<0.001; ***, P<0.0001.

