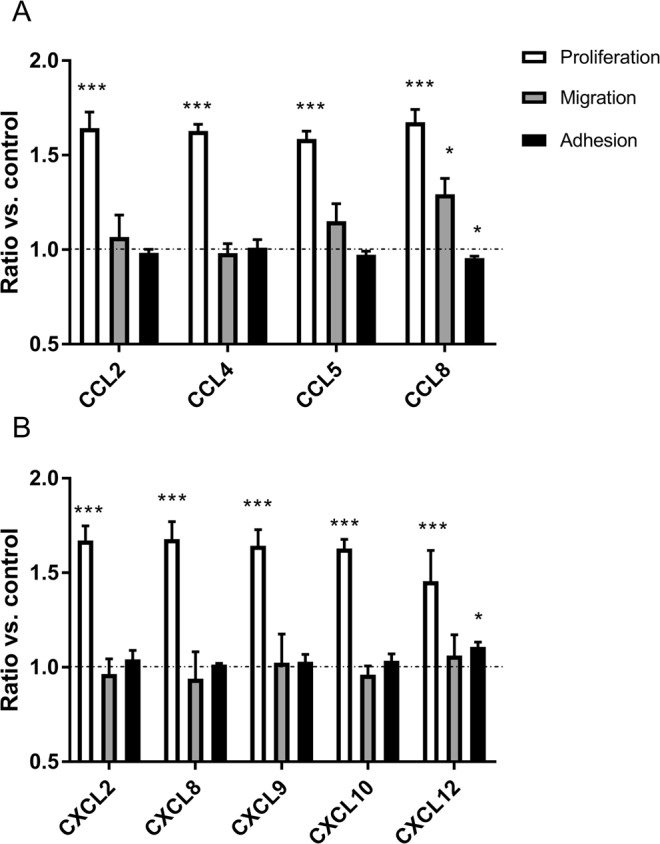
Figure 3.

Effect of treatment with –CC– (A) and –CXC– (B) chemokines on proliferation (n = 5), migration (n = 3) and adhesion (n = 5) of luminal epithelial cells. Statistical analysis was performed as comparison of results after stimulation with single chemokine to control group without any stimuli (signed as horizontal line). Asterisks indicate a significant difference in comparison to control group (*p < 0.05, ***p < 0.001). All data are expressed as the mean ± SEM. Results are presented on the same graph only to enable better analysis, but statistical analysis was performed separately for each assay (proliferation, migration, adhesion).
