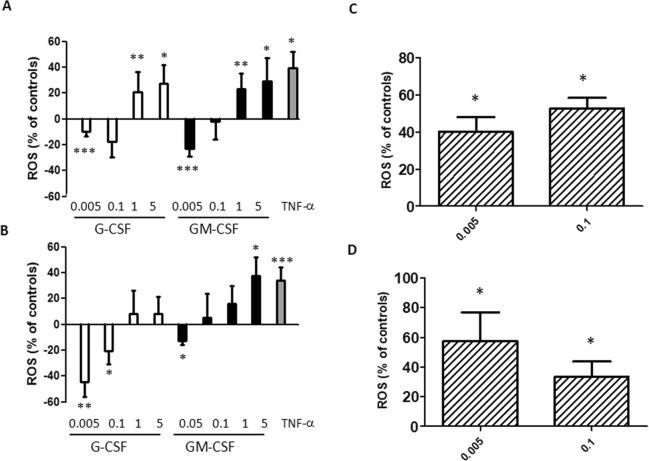
Figure 1.
Effect of G-CSF and GM-CSF on oxidative burst. Neutrophils were treated with single (A) or both CSFs (C) for 50 min, or treated with single (B) or both (D) CSFs and further incubated with 1 μM fMLP for 5 min. ROS production is given as percent of untreated cells (A,C), or cells treated with fMLP (B,D). Concentrations of CSFs are in ng/ml. TNF-α (5 ng/ml) was used as positive control. Results are shown as mean ± SEM of six experiments. Kruskall-Wallis (with Dunn’s test as post hoc test) and Mann-Whitney U-test: *P < 0.05; **P < 0.01; ***P < 0.0001 as compared with untreated controls (A,C) or fMLP-treated samples (B,D).

