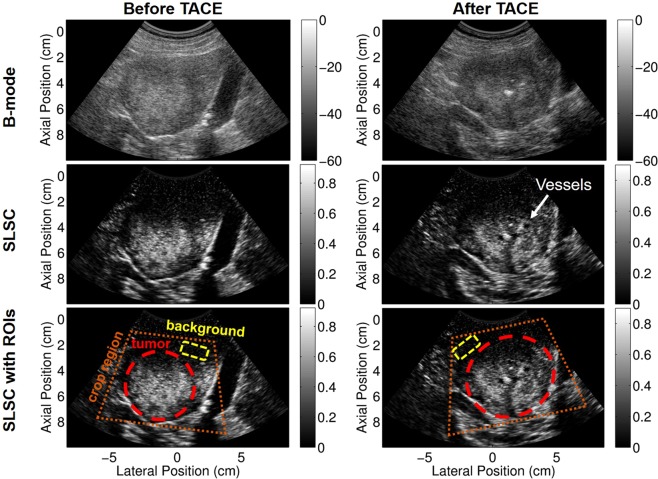
Figure 1.
Example full field of view focused B-mode (top) and SLSC (middle and bottom) images before (left) and after (right) TACE. Potential vessels are indicated in the after TACE SLSC image that are not apparent in the B-mode. Example crop region (orange), tumor (red), and background (yellow) ROIs are displayed on focused full field of view SLSC images in the bottom row. B-mode images are scaled to individual maximums and are displayed on a dB scale. SLSC images are scaled from 0 to the maximum coherence in the image.

