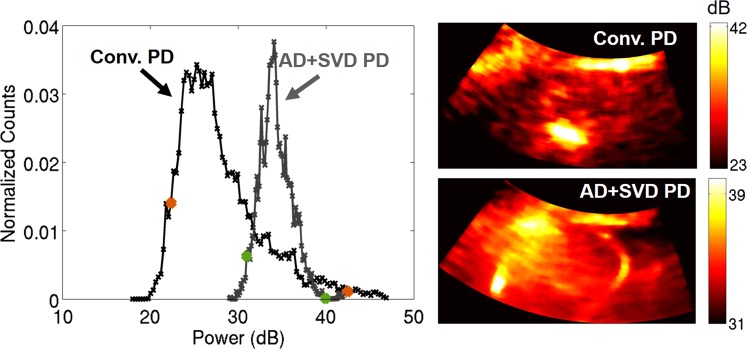
Figure 3.
Example dynamic range evaluation for subject 9 after TACE. Histograms are shown on the left for power Doppler (PD) images made with conventional methods (black) (i.e., 16-sample ensemble and IIR filtering) and with adaptive demodulation (AD) and SVD filtering (gray). Histograms were made after log compression. The orange and green dots indicate the dynamic ranges adaptively chosen (middle 70% of the full dynamic range) for the conventional and AD + SVD cases, respectively. Corresponding power Doppler (PD) images are shown on the right on dB scales. PD images were log compressed and cropped to the adaptively selected dynamic ranges.

