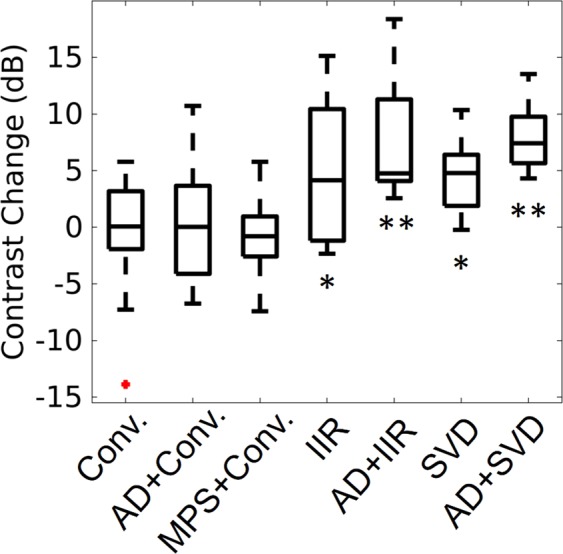
Figure 4.

Change in tumor-to-background contrast for each processing technique: Conventional (Conv.), adaptive demodulation (AD) + Conv., mean phase shift (MPS) + Conv., IIR, AD + IIR, SVD, AD + SVD. The median value for each method is the central mark in each box. The 25th and 75th percentiles are the bottom and top edges of each box, respectively. The bars extending from each box indicate the minimums and maximums, and outliers are marked in red. Statistically significant differences from the conventional method are indicated with *(p < 0.05) and **(p < 0.01).
