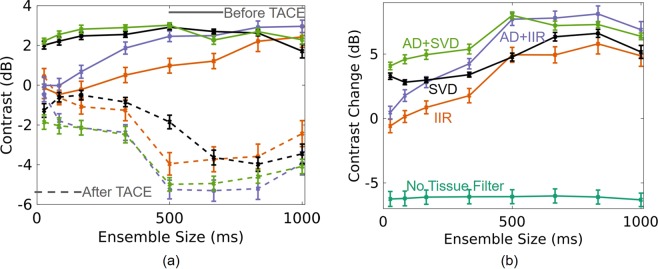
Figure 5.
Average contrast (left) and change in contrast (right) for varying ensemble sizes and for each processing method: IIR (orange), adaptive demodulation (AD) + IIR (purple), SVD (black), and AD + SVD (green). On the left, contrast values before and after TACE are shown as the solid and dashed curves, respectively. On the right, change in contrast for when no tissue filtering is used is shown in teal for reference. The no tissue filter values are negative likely because the lipiodol used during TACE is hyperechoic and becomes structure in the tumor.

