Figure 3.
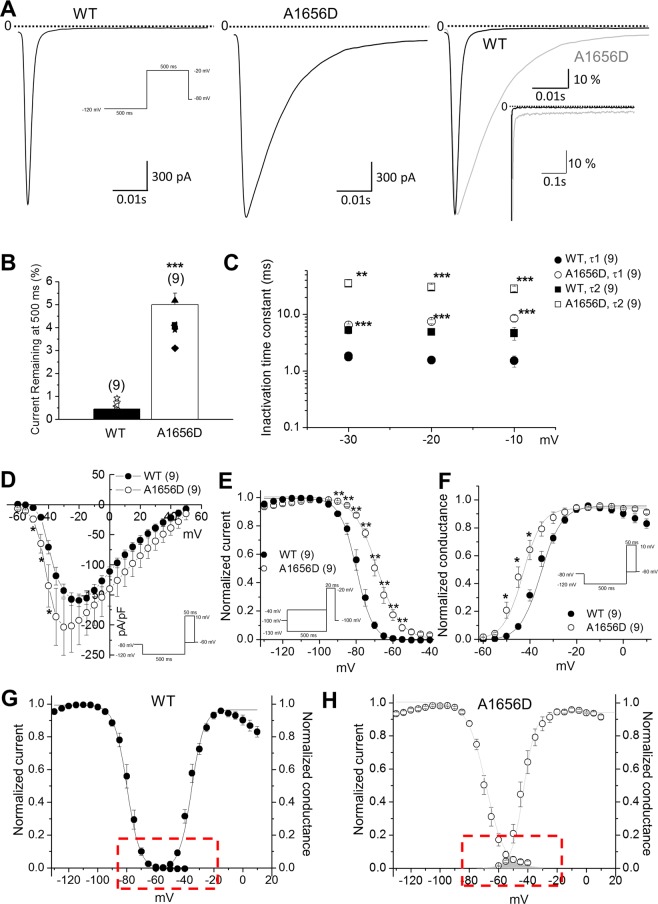
A1656D mutant channel exhibits defective INa inactivation consistent with a LQT3 phenotype. (A) Whole-cell Na+ channel currents from HEK293T cells expressing WT (left) or A1656D Nav1.5 (middle) with the β1 subunits at −20 mV (500 ms pulses applied from −120 mV holding potential at 0.2 Hz). WT and A1656D currents normalized to peak current and superimposed at high (right) and low (inset) gain. (B) Bar graph representing mean ± S.E.M. ***P < 0.001, Student’s t-test. percentage of current remaining at 500 ms with respect to peak current for both WT and A1656D Nav1.5. (C) Data represent mean ± S.E.M. **P < 0.01, ***P < 0.001, Student’s t-test. The fast and slow time constants (Tau1, Tau2) for inactivation are plotted for WT and A1656D Na+ channel. (D) Data represent mean ± S.E.M. *P < 0.05, Student’s t-test. The current-voltage (I-V) relationship for WT and A1656D currents. (E) Data represent mean ± S.E.M. **P < 0.01, ***P < 0.001, Student’s t-test. Steady-state inactivation was measured with a 500 ms conditioning pulse followed by a brief −20 mV test pulse. F. Data represent mean ± S.E.M. *P < 0.05, Student’s t-test. Steady-state activation curves, with relative conductance derived from maximal chord conductance and reversal potential (Erev) for each I–V, and peak INa/(Em − Erev). The resulting conductance was normalized to the maximal chord conductance. (G–H) Window currents of WT (G) and A1656D (H) channels. Data represent mean ± S.E.M.

