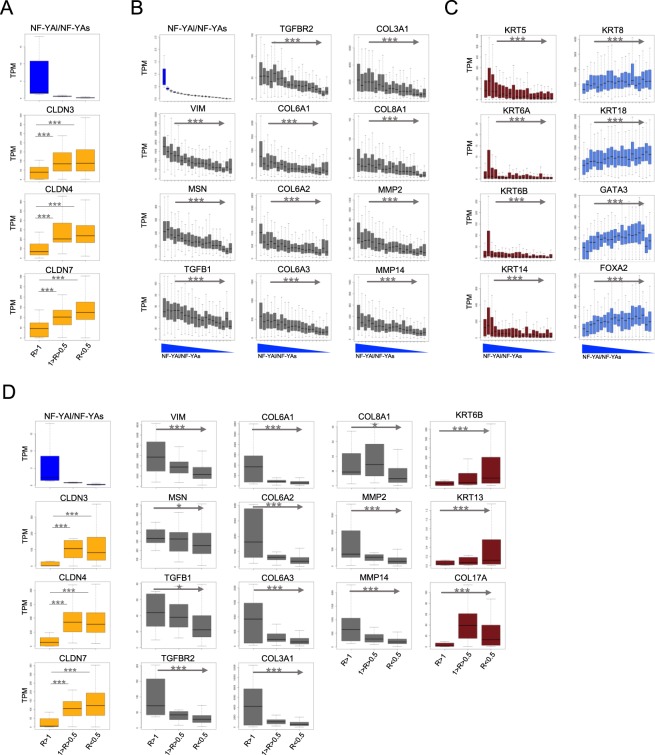
Figure 5.
Analysis of TCGA tumors partitioned according NF-YAl/NF-Ys ratios. (A) Claudin 3/4/7 expression across TCGA-BRCA tumor samples grouped according to the ratios between NF-YAl and NF-YAs expression (R). The p-values are calculated using a Wilcoxon signal-ranked test. *p-value < 10−3, **p-value < 10−4, ***p-value < 10−5. (B and C) Analysis of expression across BRCA ranked samples of the indicated markers: EMT (grey), basal epithelia keratins (dark red) and luminal keratins (light blue). Ranking of BRCA tumor samples was based on ratios between NF-YAl and NF-YAs expression. Jonckheere-Terpstra trend test was used to assess significance in gene expression increasing or decreasing trend. *p-value < 10−3, **p-value < 10−4, ***p-value < 10−5. (D) Same as B, except that PAM50 Basal-like subtype tumor samples were considered for the analysis.

