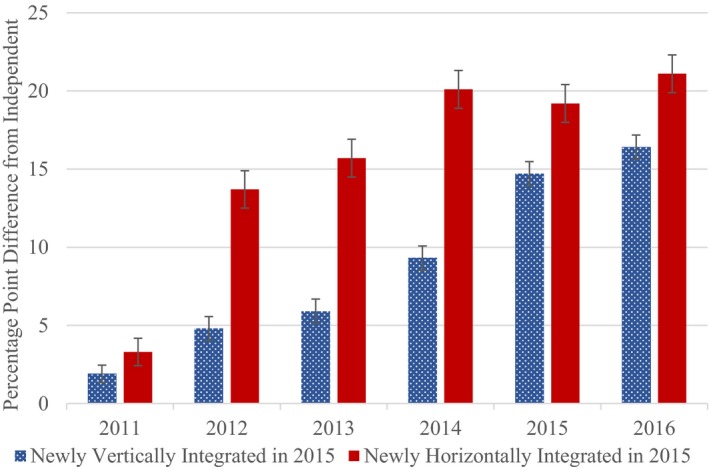
Figure 3.

Event study of physician newly integrated between 2013 and 2015, relative to always independent. Bars represent the difference in attestation rate from between physicians that remain independent and those that change status in 2015 in each year derived from linear regressions including practice size, primary vs specialty practice, whether the physician accepts Medicaid, gender, and metropolitan area. The model comparing physicians that join horizontally integrated organizations to physicians who remain independent includes 532 380 observations; the vertically integrated model includes 596 388 observations. Error bars represent 95% confidence intervals using heteroskedastic standard errors [Color figure can be viewed at wileyonlinelibrary.com]
