Fig. 5.

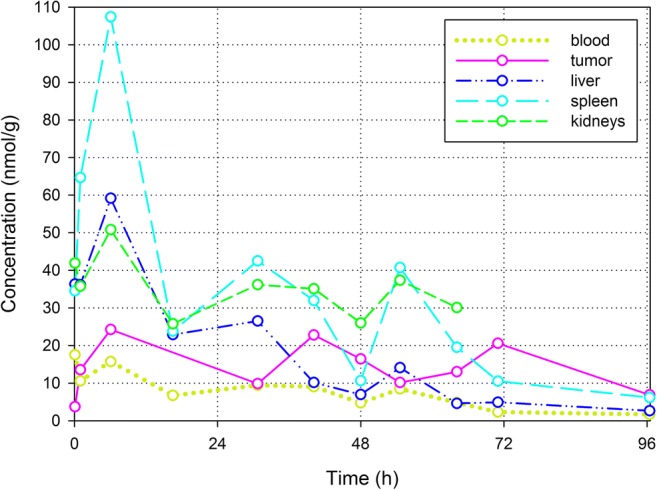
Released P concentrations in whole blood (lime; dotted line), tumor (purple; solid line), liver (dark blue; dash-dot-dot), spleen (cyan; long dash) and kidneys (green; short dash)

Released P concentrations in whole blood (lime; dotted line), tumor (purple; solid line), liver (dark blue; dash-dot-dot), spleen (cyan; long dash) and kidneys (green; short dash)