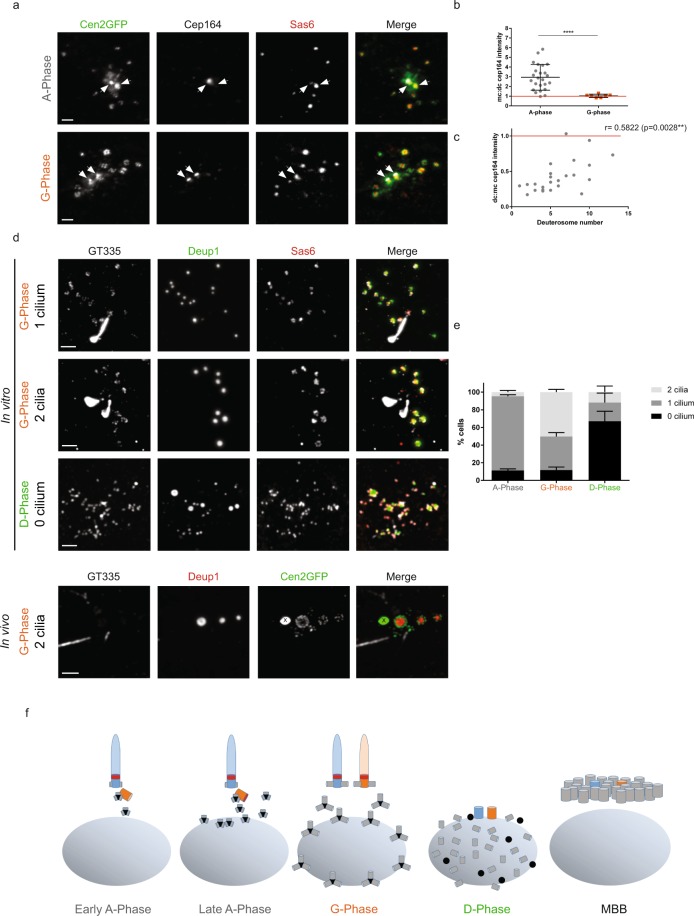
Figure 2.
Daughter-to-mother centriole conversion at the A- to G-phase transition. (a) Cep164 and Sas6 immunostainings on Cen2GFP ependymal progenitors during A- and G-Phases. Arrows indicate centrosomal centrioles. (b) Mother:daughter centriole (mc:dc) Cep164 signal ratios in A-phase (n = 24 cells) and G-Phase (n = 7 cells). (c) Correlation between mc:dc Cep164 signal ratios and deuterosome numbers in the cells during A-Phase (n = 24 cells from b). (d) GT335, Deup1 and Sas6 immunostainings on ependymal progenitors during G- and D-Phases in vitro and G-phase in vivo. (e) Percentage of cells with 0, 1 or 2 GT335 positive cilia in A-, G- and D-phases in vitro (n = 210, 73 and 21 cells in A-, G- and D-phase, respectively). (f) Representative scheme of centrosomal centriole behaviour during centriole amplification. Nucleus is represented in gray, deuterosomes in black, procentrioles in gray, Cep164 in red, mother centriole in blue, daughter centriole in orange. « X » indicates Cen2GFP aggregate. Scale bars: 2 µm.

