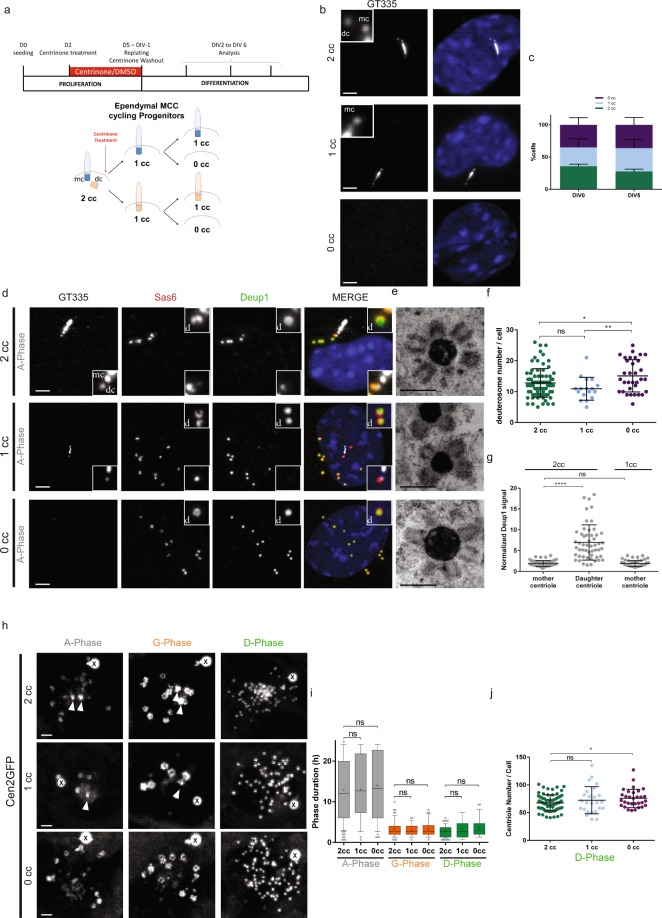
Figure 3.
Depletion of centrosomal centrioles only slightly affects centriole amplification in brain MCC. (a) Experimental procedure used to deplete centrosomal centrioles in MCC cycling progenitors using centrinone. See methods. 2cc, 1cc or 0cc for 2, 1 or 0 centrosomal centriole(s), respectively. (b) Representative pictures of 2cc, 1cc or 0cc ependymal progenitor cells stained with GT335. (c) Repartition of 2cc, 1cc or 0cc cell populations at two different days of differentiation (DIV for Day In Vitro). Cells selected for this quantification are ependymal progenitors that have not started centriole amplification (« centrosome » stage; n = 912 and 566 cells at DIV0 and DIV5 respectively). (d) Representative GT335, Deup1 and Sas6 immunostainings of 2cc, 1cc or 0cc cells during A-Phase. Zoom in pictures highlight deuterosomes « d » and centrosomal centrioles (mc: mother centriole and dc: daughter centriole). (e) Representative EM pictures of deuterosomes in 2cc, 1cc or 0cc cells. The status of the centrosome was identified by correlative light and electron microscopy. (f) Quantification of deuterosome number per cell in 2cc, 1cc or 0cc cells during G-Phase. 2cc cells have been taken from DMSO and centrinone-treated cultures (n = 80, 17, 33 cells for 2cc, 1cc and 0cc, respectively). (g) Normalized Deup1 signal (centrosomal centriole:cytoplasmic Deup1 signal) on mother and daughter centriole in 2cc cells, or on mother centriole in 1cc cells during A-Phase (n = 52 and 54 cells for 2cc and 1cc respectively). (h) Sequences from time lapse experiments on 2cc, 1cc or 0cc Cen2GFP cells. Note that a Cen2GFP cloud is still present in 0cc cells. (i) Box (25 to 75%) and whisker (10 to 90%) plots of A- (Gray), G- (Orange), and D- (Green) phase duration in 2cc, 1cc or 0cc Cen2GFP progenitors. Lines indicate medians, and crosses indicate means. 2cc cells have been taken from DMSO and centrinone-treated cultures (in A-Phase: n = 107 cells for 2cc; n = 36 cells for 1cc; n = 49 cells for 0cc; in G-Phase: n = 73 cells for 2cc; n = 32 cells for 1cc; n = 36 cells for 0cc; in D-Phase: n = 65 cells for 2cc; n = 25 cells for 1cc; n = 28 cells for 0cc). (j) Final centriole number counted during D-Phase in 2cc, 1cc or 0cc Cen2GFP progenitors. Because centrosomal centrioles are no longer distinguishable from maturing procentrioles in D-Phase, quantification is performed after Cen2GFP videomicroscopy to know the orignal centrosome status of the cells. 2cc cells have been taken from DMSO and centrinone-treated cultures (n = 69 cells for 2cc; n = 25 cells for 1cc; n = 31 cells for 0cc). Arrows indicate centrosomal centrioles. « X » indicates GFP aggregates. Scale bars: 2 µm for optical microscopy, 500 nm for EM.

