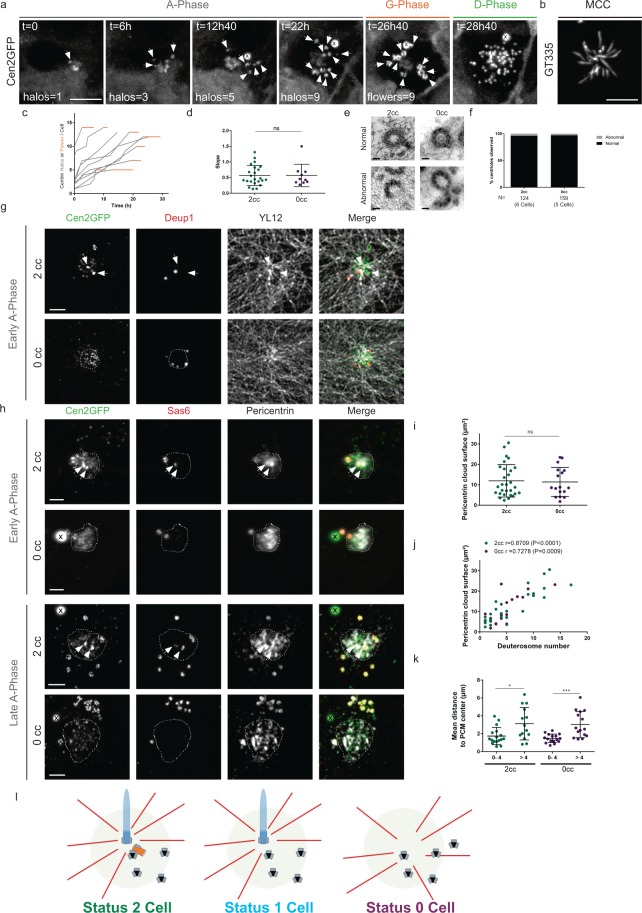
Figure 4.
Centrosomal centriole-depleted cells form procentrioles within an acentriolar PCM cloud. (a) Live imaging of a Cen2GFP ependymal progenitor depleted from centrosomal centrioles undergoing the different stages (A-, G- and D-Phase) of centriole amplification. (b) GT335 immunostaining of a 0cc Cen2GFP ependymal MCC at the end of the time lapse experiment. (c) Number of centrin halos (Gray) or flowers (Orange) during time lapse experiments in 0cc Cen2GFP ependymal progenitors (Δt = 40 min, n = 10 cells). Timepoints are chosen when halos or flowers number is clearly visible. (d) Comparison of centrin halo formation rate between 2cc or 0cc cells during A-Phase. Each dot represents the trendline slope corresponding to a cell observed during A-Phase in Fig. 1c (2cc cells) and (c) (0cc cells). (e) Representative pictures of normal and abnormal centrioles ultrastructure in 2cc or 0cc cells observed at the multiple basal body stage. See methods. (f) Quantification of the integrity of centrioles ultrastructure in 2cc (6 cells observed in differentiated control cultures) and 0cc cells (5 cells observed with CLEM after videomicroscopy; See Methods). (g) Immunostainings showing deuterosome localization (Deup1) and the tyrosinated tubulin network (YL12) in 2cc or 0cc cells during early A-Phase. In 2cc cells, microtubule network converges on one centrosomal centriole whereas in 0cc cells, it converges on Cen2GFP cloud. Dashed line delineates Cen2GFP cloud. (h) Representative pictures of Pericentrin and Sas6 immunostainings during early or late A-Phase in 2cc or 0cc cells. Dashed line delineates the Pericentrin cloud. (i) Surface of the Pericentrin cloud in 2cc and 0cc cells during A-phase (n = 29 cells for 2cc, n = 17 cells for 0cc). (j) Correlation between the Pericentrin cloud surface and the number of deuterosomes in the cell in 2cc (green) or 0cc (purple) cells (n = 29 cells for 2cc, n = 17 cells for 0cc). (k) Mean distance of deuterosomes to PCM center depending on the number of deuterosomes in the cells for 2cc and 0cc cells (for 2cc: 0–4 deuterosomes: n = 17 cells; >4 deuterosomes: n = 14 cells. for 0cc: 0–4 deuterosomes: n = 16 cells; >4 deuterosomes: n = 15). (l) Model for centriole amplification in 2cc, 1cc or 0cc cells. PCM cloud is represented in light green, deuterosomes in black, procentrioles in gray, microtubules in red. Arrows indicate centrosomal centrioles. « X » indicates GFP aggregates. Scale bars: (a,b) 5 µm: (e) 100 nm, (g,h) 2 µm.

