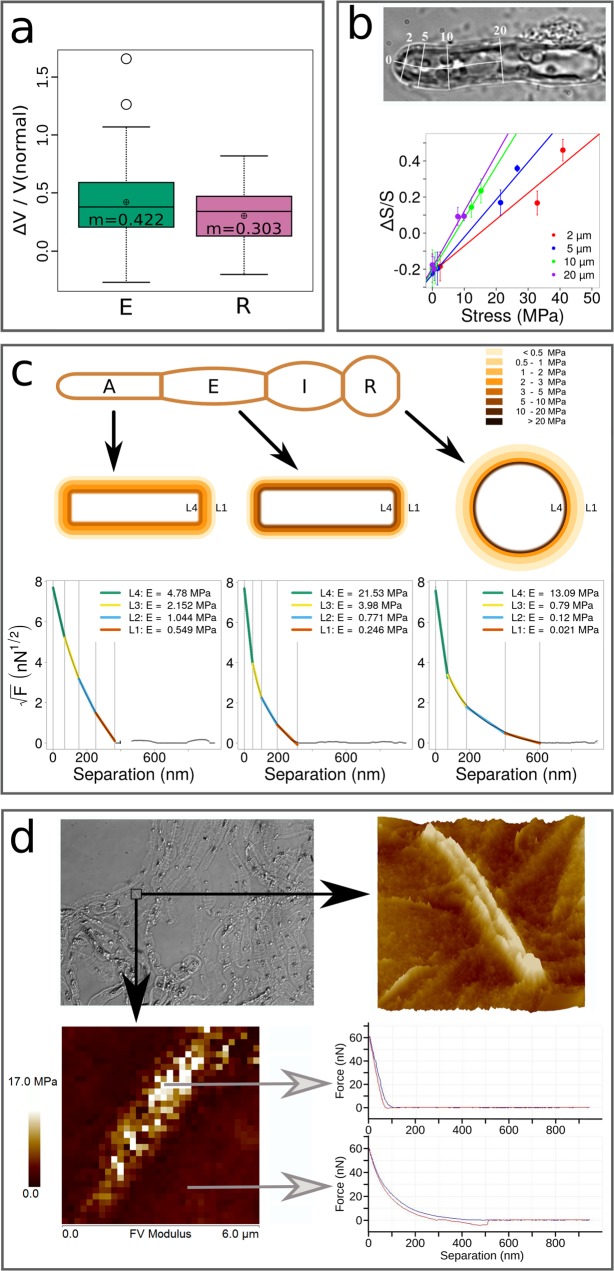
Figure 10.
Stiffness along the filament. (a) Stiffness between E and R cells measured by dilatation/retraction experiments. Cell expansion was observed in response to immersion into fresh water. Plot represents the ratio of volume of E and R cells before and after immersion. Volumes were calculated from the cell dimensions, namely their length and width assuming that they are symmetrical. Measurements were carried out by ImageJ on bright field photos. n = 99 for E cells and n = 55 for R cells. T-test P value = 0.0106. (b) Stiffness in the dome measured by dilatation/retractation. The circumferential deformation of Ectocarpus apical cells was plotted as a function of the distance from the tip. Cells were subjected to inflation or retraction by transfer into hypo- or hypertonic sea waters respectively (see text for details). (Top) Relative circumferential deformation was measured at 2, 5, 10 and 20 µm from the tip. (Bottom) The deformation (calculated on a cell wall ring; ΔS/S) was plotted as a function of the local cell wall stress (σe) calculated at each position after the deformation was stabilised. Normal condition (sea water ~1000 mOsmol L−1) is set to 0 (no deformation) for the four curves. n = 63 cells for each curve. (c) Stiffness along the filament measured by nano-indentation using Atomic Force Microscopy. (Top) Scheme representing a filament stereotype indicating the position of the four cell types. (Middle) Schemes representing the section of A, E and R cell types with four virtual layers whose thicknesses were inferred from the slope of the force curve. Colour stands for the average Elastic Modulus calculated from the force curves (n = 6 for A cells, n = 7 for E cells, and n = 4 for R cells; Table 1), based on the Sneddon model (see Methods for details about calculation). (Bottom) Example of one force curve for each cell type. X-axis: distance of separation (nm); Y-axis: square root of force (nN1/2). (d) Stiffness at transverse junctions by AFM. Three junctions were imaged independently for three distinct filaments and gave similar results. Only one is shown here. (Top left) DIC image of extracted cell walls from filaments (see text for details). The transverse junction is framed. (Top right) Topography image of the transverse junction between two R cells, showing the relief of the central structure. (Bottom left) Corresponding elasticity map of 6 × 6 µm area (36 µm2) extracted from an array of 32 × 32 (1024) force curves. Force curves measured at the junction (top) and at the surrounding surface (bottom). Indentation: blue curve; retractation: red curve. Several acquisitions were carried out for each junction and gave similar data.

