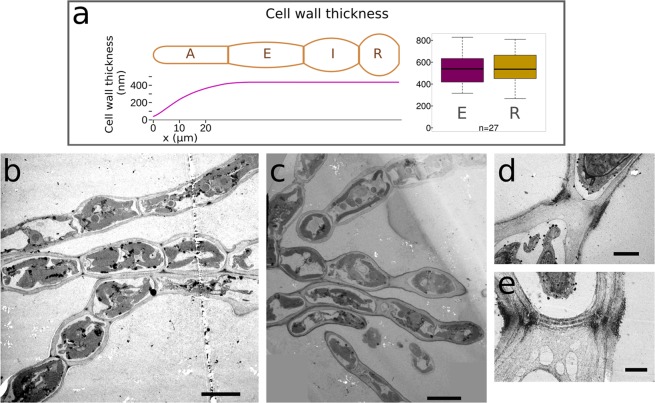
Figure 6.
Cell wall thickness and structure along the filament. (a) (Right) Quantification of cell wall thickness in E and R cell types from TEM micrographs (n = 27, Student t-test, P value = 0.867), and (Left) Schematic representation summarising the cell wall thickness (y-axis, in nm) in different cell types along the filament (x-axis, in µm). (b,c) Representative TEM longitudinal sections showing uniform cell wall organisation and thickness along the filaments. (d,e) Higher magnification of transverse junctions showing the presence of dark rings. Scales 10 µm (b,c), 2 µm (d) or 1 µm (e).

