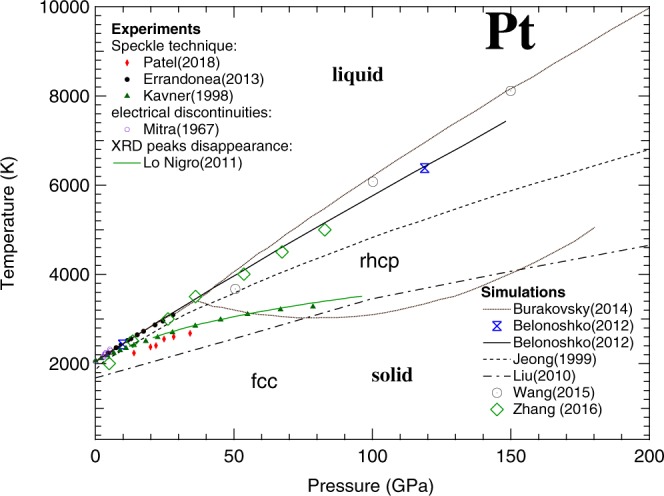
Figure 1.

State of the art of the phase diagram of Pt as experimentally measured (solid symbols) and theoretically calculated (lines and empty symbols). The dotted lines represent the solid-solid (fcc to rhcp) and solid-liquid phase boundaries predicted in Burakovsky et al.23. In this figure all the studies described in the text are reported with the only exception of the one by Strong et al.10 (results similar to Mitra et al.11) for clarity reasons.
