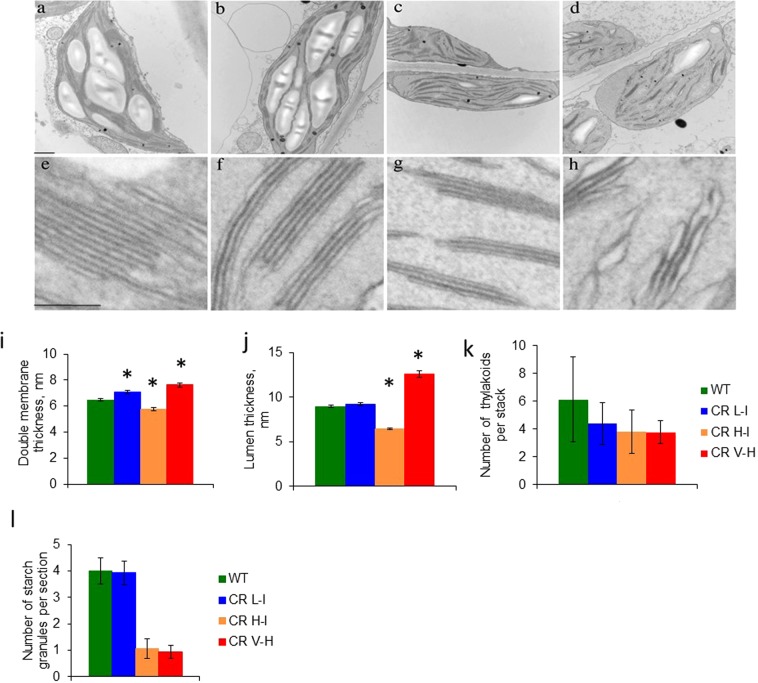
Figure 4.
Comparison of thylakoid structure of WT and CR transgenics. (a–h) Analysis of thylakoid membranes from the wild type and CR transgenic lines by transmission electron microscopy. Leaves from 3-week-old wild-type and CR L-I, CR H-I, and CR V-H plants were directly fixed 3 h after the start of the light phase of the growth photoperiod and prepared for transmission electron microscopy. Chloroplast sections are shown for the wild type (a,e), CR L-I (b,f), CR H-I (c,g), and CR V-H (d,h) plants. Bars in the top and bottom panels = 50 and 100 nm, respectively (i). The thickness of thylakoid double membranes in WT and CR L-I, CR H-I, and CR V-H transgenics, (j) The thickness of lumen in WT and CR transgenics, (k) Amount of thylakoids per granum in wild type and mutants. Average and maximum number of thylakoids per stack are shown (l). Amount of starch granules per section in chloroplasts of WT and CR L-I, CR H-I, and CR V-H plants. Values are based on at least 15 independent measurements plus or minus SD.

