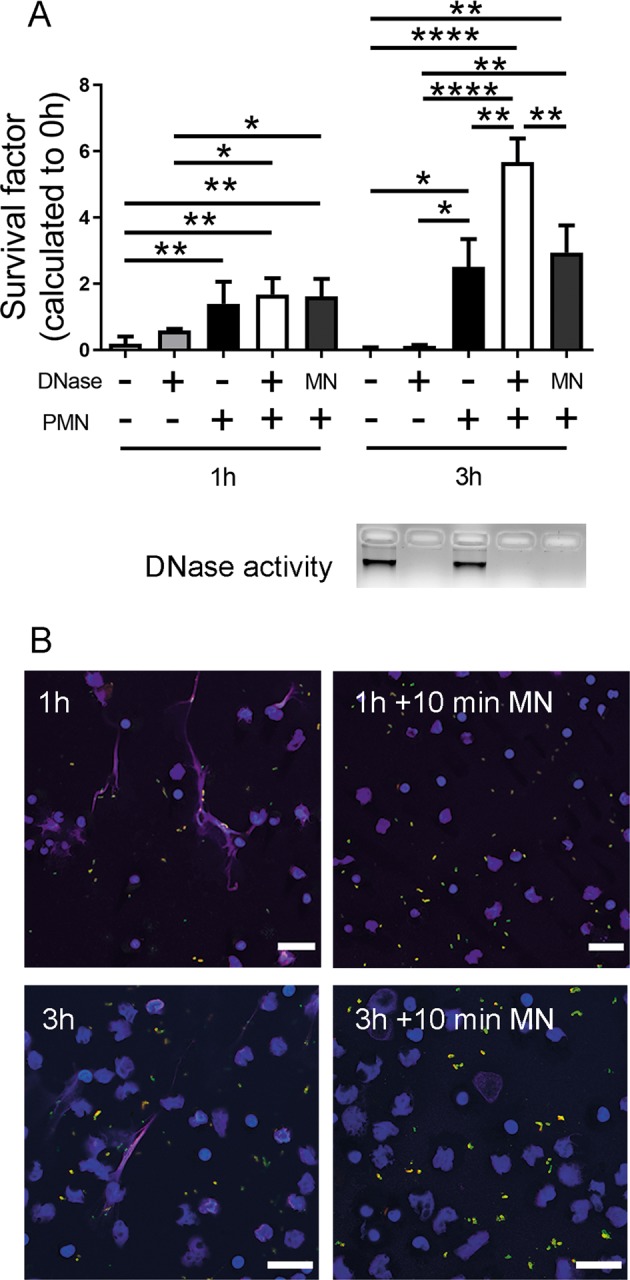
Fig. 2. Control experiments to quantify the amount of bacteria sticking to NETs and to evaluate phagocytic activity of neutrophils.

a A.pp was grown and the survival factor was calculated as described in Fig. 1e and f. The sample with neutrophils and A.pp was treated with micrococcal nuclease (MN) for 10 min at the end of incubation to release bacteria entrapped in NETs. The efficacy of treatment was verified with DNase activity test (agarose gel electrophoresis), as well as immunofluorescence microscopy (right panel in b). Data are shown as mean ± SD (n = 3, one-way ANOVA 1 h P = 0.0010 and 3 h P < 0.0001, followed by Tukey’s multiple comparison test). b Neutrophils were incubated with A.pp for 3 h 37 °C, 5% CO2 and the cells were fixed. Afterwards staining for NETs and A.pp was conducted (blue = DNA (Hoechst), magenta = DNA/histone‐1‐complexes (NETs), red and green = extracellular A.pp, green = intracellular A.pp). Representative pictures are shown (scale bar = 20 µm). For the pictures the main focus was to present neutrophils and NET structures. Therefore, the pictures are zoom pictures on specific areas and adjusted to the focus level for neutrophils/NETs. Amount of A.pp visible in different focus planes of images varies a lot, thus, the shown image does not necessarily reflect average A.pp level found per sample
